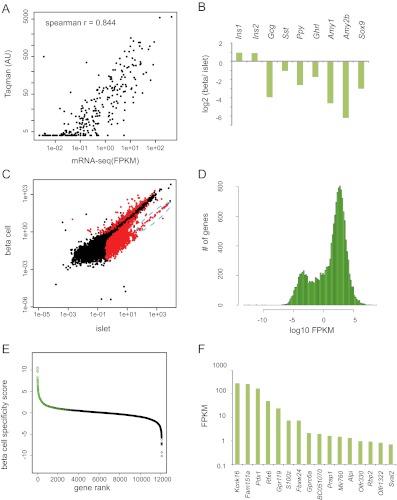
Fig. 1.
mRNA-seq of mouse islets and primary mouse β-cells demonstrates β-cell-specific genes. A, A comparison of RT-qPCR quantification (y-axis) and mRNA-seq quantification (x-axis) of GPCR expression. Each point represents a single GPCR gene. RT-qPCR data were plotted with permission (16). B, Log base 2-fold change in normalized read counts from β-cells vs. islets for the indicated genes. All were statistically significant with q value < 1 × 10⁻¹⁴. C, Identification of RefSeq genes enriched and depleted in β-cells. FPKM in β-cells (y-axis) is plotted vs. the FPKM in islets (x-axis). Red dots indicate a q value < 0.1. Black dots indicate q value > 0.1. The blue dashed oval is highly enriched for exocrine secreted enzymes (see text). D, Histogram of FPKM levels of RefSeq genes expressed in β-cells. E, Log base 10 ratio of β-cell FPKM to the average FPKM of all non-β tissues is plotted (β-cell specificity score) for β-cell-expressed genes. Green circles indicate genes statistically significantly increased in β-cells over all five non-β-cell tissues (q value < 0.1). F, FPKM values of the 16 genes with no detectable expression in any of the other five non-β-cell tissues examined. AU, Arbitrary units.

