
Fig. 9.
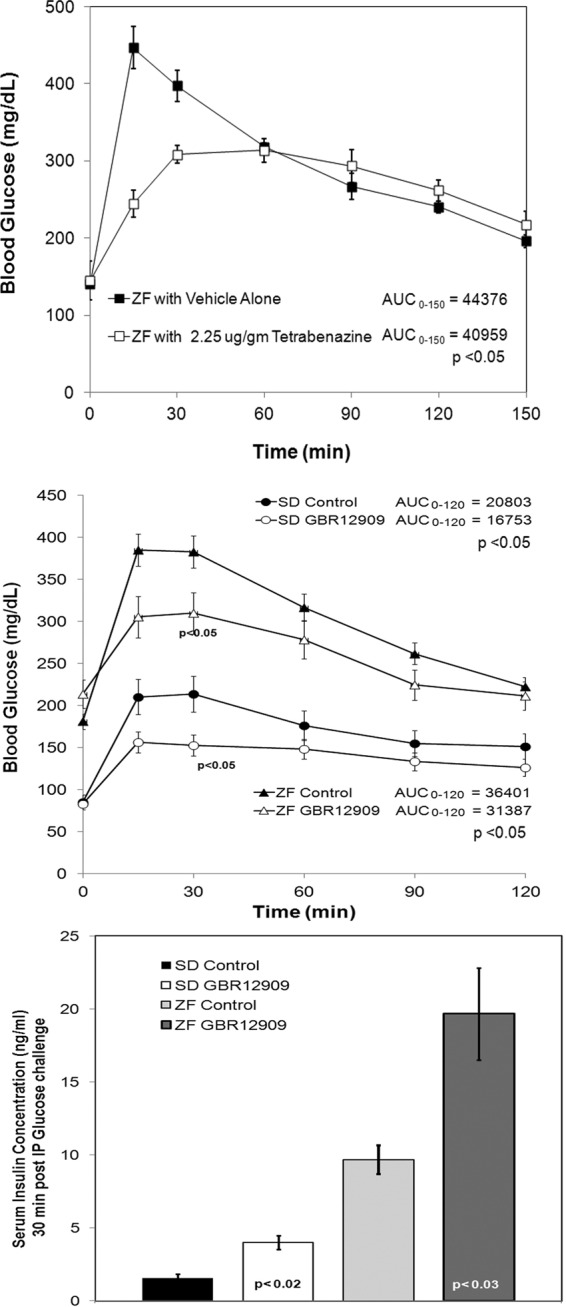
Top panel, TBZ reduces the blood glucose excursion during Intraperitoneal Glucose Tolerance Test (IPGTT) in male ZF (obese) rats. Mean blood glucose values during IPGTT of ZF rats treated with vehicle alone (■, n = 4) or with TBZ at 2.25 μg/g body weight (□, n = 5). Error bars represent the sem. The area under the curve (AUC) for each rodent's blood glucose vs. time profile was calculated using the trapezoid rule. The average AUC was calculated and compared between control and TBZ-treated groups. The P value of the significance of the comparison of AUC by t test is shown. Middle panel, GBR 12909 reduces the blood glucose excursions during IPGTT in male ZF (obese) and SD rats. Mean blood glucose values during IPGTT of rats treated with vehicle alone (▴ and ●, n = 5) or with GBR 12909 at 5.0 μg/g body weight (▵ and ○, n = 5). The comparison of AUC was performed as detailed above. Bottom panel, Sera collected at 30 min after IPGTT from the experiments shown above were assayed for insulin. The mean serum insulin concentrations for treated rats were compared with the values of untreated rats. The significance of comparison was determined by t test and is indicated within the bar.