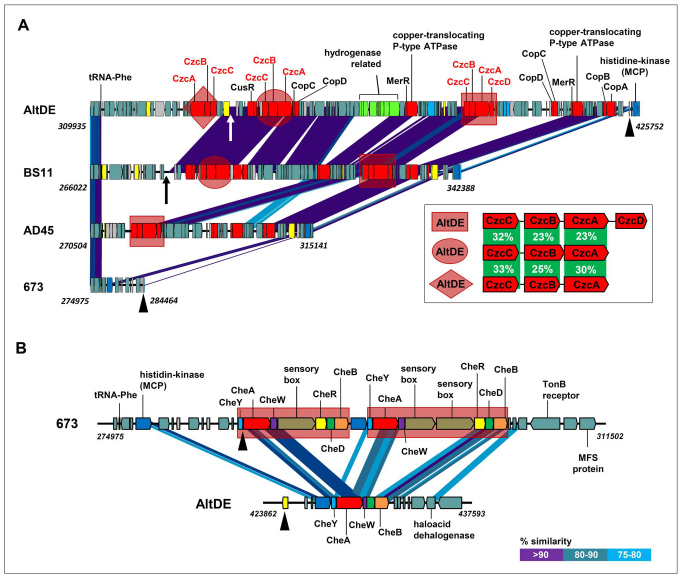
Figure 5. Variations in the metal resistance related island.
(A) tRNA-Phe related variable region (GIA in Figure 2). Regions highlighted by geometric figures (square, diamond or ellipse) show clusters of czc genes. The clusters highlighted by the same figure are identical in sequence. Arrows under BS11 and AltDE indicate the 3′ end of the tRNA gene section that is duplicated and represents a hallmark of an integration event. Inset in figure show the percentage of identity among the three paralogous sets of Czc clusters found in AltDE (or the two in BS11). Numbers on the left indicate the position in the genome of the Phe-tRNA first nucleotide. The numbers to the right are the positions of the 3′ end of the last gene represented at this end. (B) Region downstream of GIA (or just the Phe-tRNA gene in 673) that is common to all the surface isolates but very different in AltDE. The duplication of the major chemotaxis pathway in the surface isolates (only the one in 673 is indicated) is highlighted as brown rectangles. Black triangles indicate equivalent genomic locations in panel A and B.

