
Fig. 6.
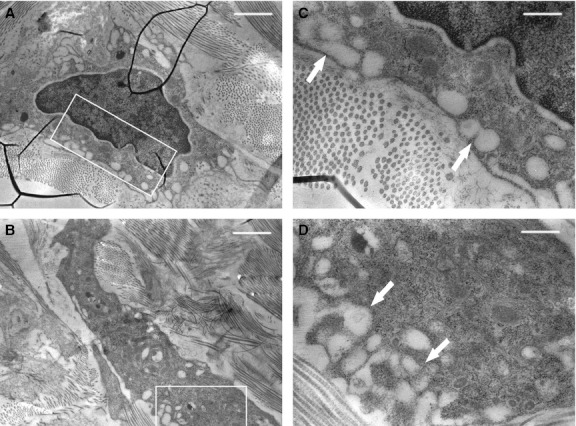
TEM micrographs of tenocytes taken from a microscopic field near the lesion. Note the cytoplasm vacuolization (arrows), indicative of degeneration. (C and D) Enlargements of the squared areas, respectively, in (A) and (B). Scale bars: 1.4 μm (A, B); 0.4 μm (C, D).