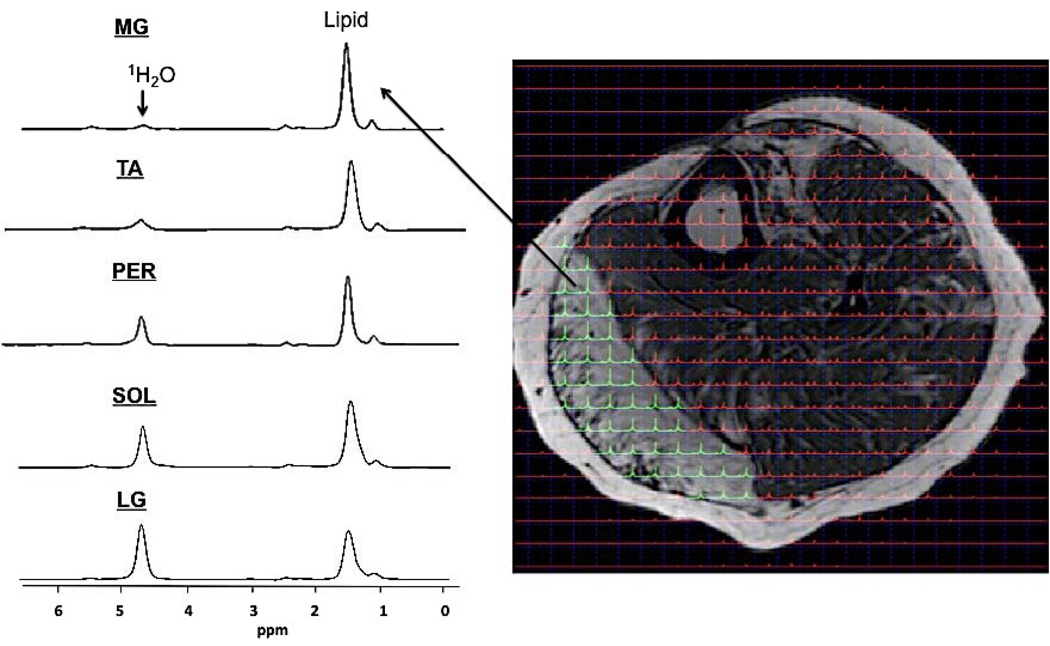
Figure 6.
Spectrum obtained from left lower leg muscles of the MFCDMD using 2D PRESS CSI. Spectra were obtained using a 12×12 matrix (1×1 cm voxels), zero filled to 24×24, and overlaid on an axial image. Spectra were summed within each muscle to create a single spectrum and relative lipid fraction measures were calculated for the MG, Per, TA, Sol, and LG. These values showed considerable heterogeneity among muscles (MG: 0.93; TA: 0.84; Per: 0.72; Sol: 0.68; LG: 0.55) and were greater than average Con values (0.23).

