Fig. 2.
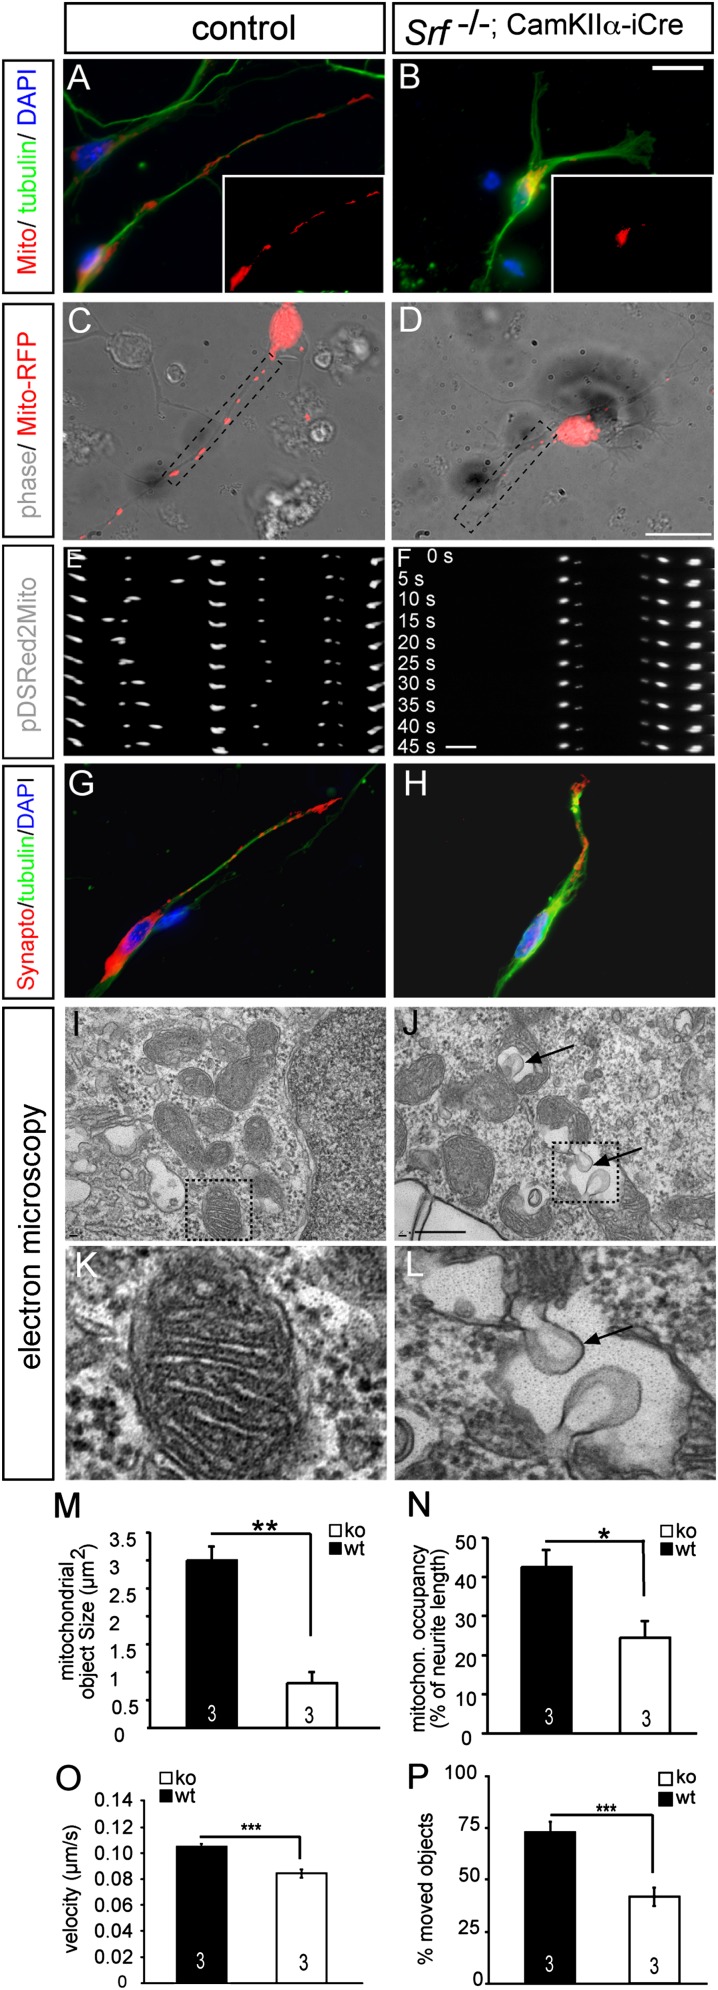
SRF deficiency modulates mitochondrial size, localization, and shape in vitro. (A and B) Primary mouse hippocampal neurons express pDSRed2Mito, allowing for mitochondrial visualization (red, Insets). (A) In WT neurons, mitochondria of variable size were present throughout the neurite. (B) In neurons lacking SRF, mitochondria accumulated in the cell body and only rarely entered neurites. (Insets) pDSRed2Mito signal of the entire neuron is shown. A WT neuron (C) and Srf mutant neuron (D) expressing pDSRed2Mito were used for time-lapse videomicroscopy. (E and F) Dashed areas show the position of individual frames. (E) In WT neurons, mitochondria move between frames taken every 5 s. (F) In contrast, on SRF ablation, almost no mitochondrial movement was observed. Size and distribution of synaptophysin were comparable between WT (G) and mutant (H) neurons. EM pictures of WT (I and K) and Srf mutant (J and L) hippocampal neurons in culture. (I and K) In WT neurons, double membranes and cristae structures are discernible. In Srf mutant neurons, balloon-shaped inclusions were observed (arrows in J and L). K and L are higher magnifications of dashed areas in I and J. (M) Quantification of mitochondrial object size in WT (wt) and SRF-deficient neurons. ko, knockout. (N) Percentage of neurite length occupied by mitochondria (mitochron.) is decreased in SRF-deficient neurons compared with WT. (O) Velocity of mitochondrial transport in WT and Srf mutant neurons. (P) Percentage of mitochondrial objects engaged in transport is depicted. (*P < 0.05; **P < 0.01; ***P < 0.001.) Numbers in bars represent numbers of independent experiments. (Scale bar: A–D, G, and H, 10 μm; E and F, 3 μm; I and J, 1 μm; K and L, 100 μm.)

