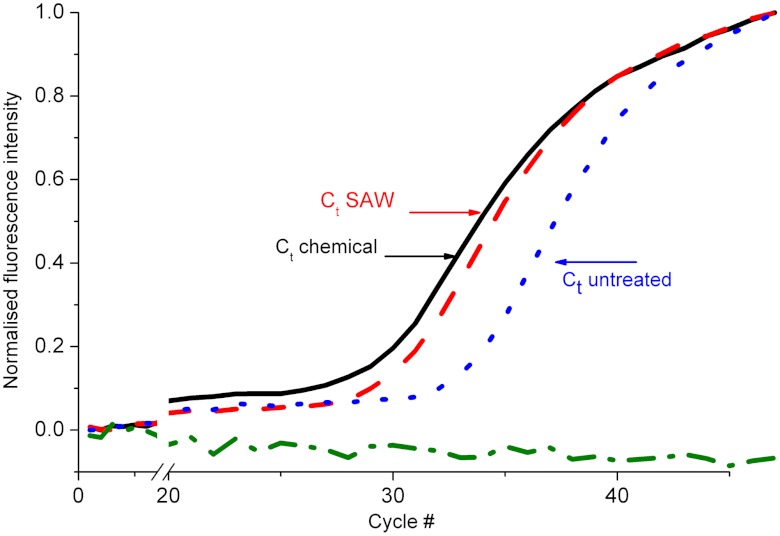
Fig. 3.
Amplification of DNA released from diluted whole blood. Real-time PCR curves showing the intensity of fluorescence as a function of the amplification cycle for untreated blood (blue, dash), chemically lysed blood (black), SAW-lysed blood (red, long dash), and a control (no template, green, dash-dot). The x axis is broken to show more detail at the exponential phase. The cycle number Ct is the abscise of the secondary inflexion point (SI Appendix, Methods). Results show an increase in the amount of DNA in the samples after lysis in similar proportions for chemical or SAW-based lysis.

