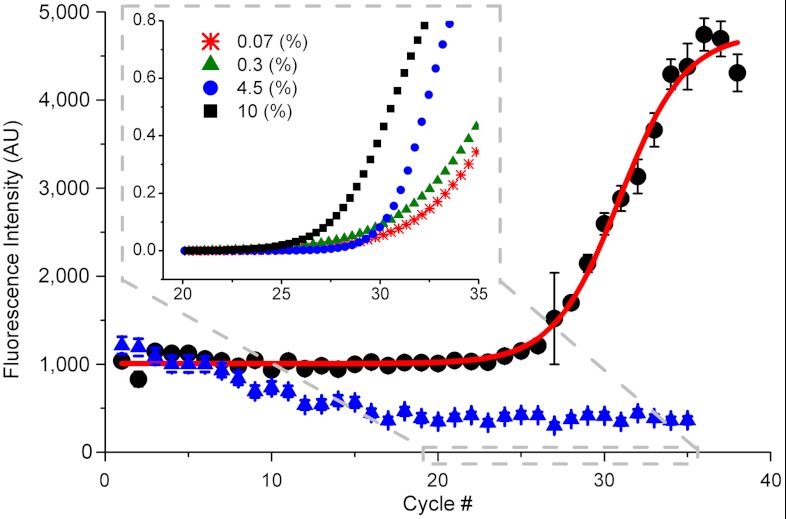
Fig. 4.
SAW real-time PCR. Fluorescence intensity (arbitrary units) for each cycle showing the amplification of infected mouse blood at 4.5% parasitemia (black dots) but not of noninfected mouse blood (0%, blue triangle). The nonlinear fit (red line) is performed with a sigmoid function in Origin 8.0. Error bars are standard deviation over 1 s measurement. Inset shows a close up on the region where the signal overcomes the background for different parasitemia levels, 10% (black square), 4.5% (blue dot), 0.3% (green triangle), and 0.07% (red star). The fluorescence signal was normalized to 0–1 for easier comparison, showing an earlier rise for higher concentrations of parasites.

