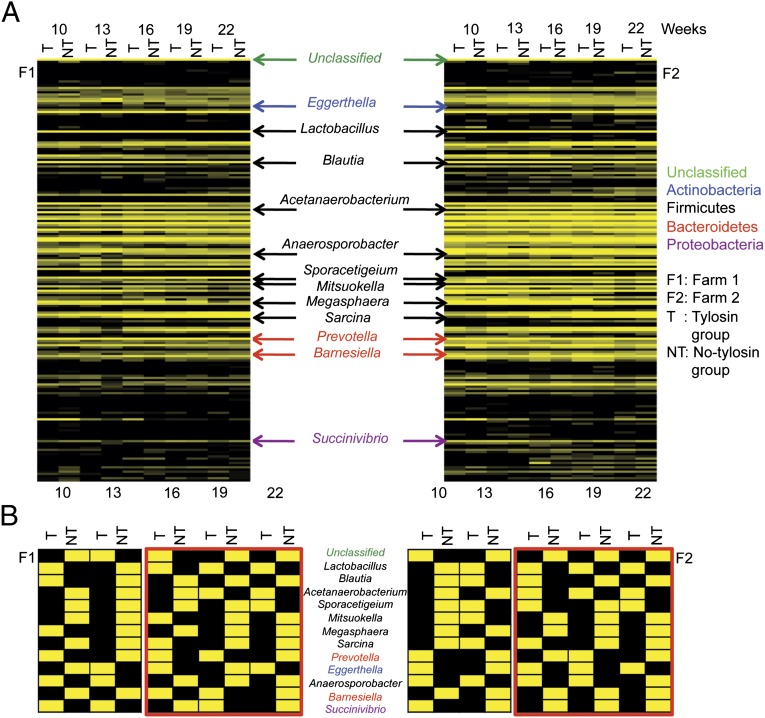
Fig. 2.
Differentially abundant genera between tylosin and no-tylosin groups. Pigs in the tylosin groups received tylosin in their feed during the whole experimental period (10–22 wk of age), whereas pigs in the no-tylosin groups did not receive tylosin. The heat map was created using genus based results after normalization. Yellow indicates abundant genera and black indicates less abundant genera. Each column represents groups and each row indicates genus. F1 and F2 indicate farm 1 and farm 2, respectively, and T and NT represent each tylosin group and no-tylosin group. (A) Differentially abundant genera were indicated by arrows and color-coded. Genus names indicate by the color their relationship to the phylum level. (B) Twelve differentially abundant genera and unclassified genera.

