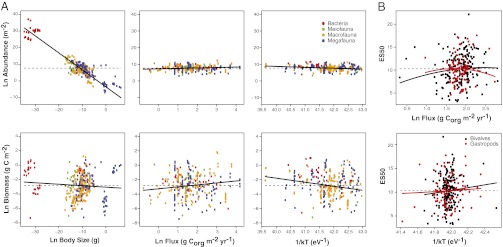
Fig. 3.
(A) Partial regression plots of body size, carbon flux, and temperature scaling of abundance and biomass in benthic deep-sea bacteria, meiofauna, macrofauna, and megafauna. Partial regression plots are provided instead of raw data to visualize the independent contributions of each factor. Mean values of predictor and response variables were added to residual values for the x and y axes, respectively. Solid lines denote fitted regressions, with slope equal to the parameter estimate in the spatial eigenvector model. Dashed lines indicate response variable mean. Corg = organic carbon. (B) Partial regression plots of carbon flux and temperature scaling of diversity (measured as the expected number of species at 50 individuals) for benthic deep-sea gastropods and bivalves of the Atlantic Ocean. Partial regression plots are provided instead of raw data to visualize the independent contributions of each factor. Mean values of predictor and response variables were added to residual values for the x and y axes, respectively. Solid lines denote fitted regressions, with slope equal to the parameter estimate in the spatial eigenvector model. Dashed lines indicate response variable mean. Full results for the models can be found in Tables 1 and 2.

