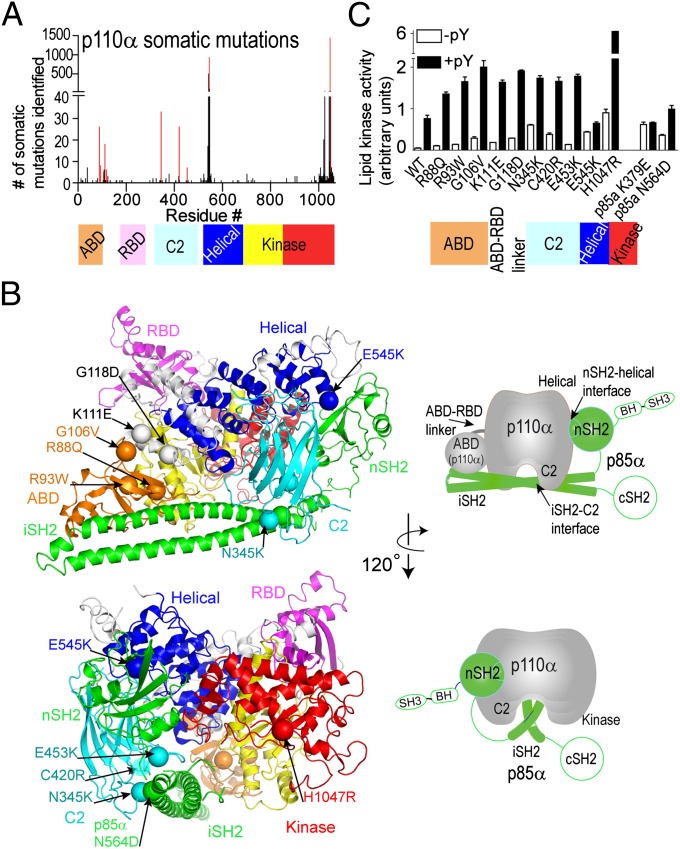
Fig. 1.
Distribution and activity of cancer-associated p110α/p85α mutants. (A) Frequency of somatic mutations in p110α versus residue number, with domains of p110α colored. Bars for mutations analyzed in this study are highlighted in red. (B) Locations of cancer-linked mutants analyzed in this study are shown as spheres mapped on the crystal structure of p110α/niSH2-p85α (Protein DataBank, pdb: 3HHM). Schematics of the crystal structure with catalytic subunit in gray and p85 in green simplify the views presented. The p85 domains missing from the crystal structure are outlined in green. (C) Lipid kinase assays of somatic mutants. Assays measured 32P-PIP3 production. Assays were performed in duplicate and repeated twice.

