Fig. 5.
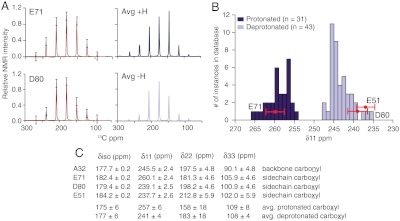
A summary of the chemical-shift anisotropy measurements at E71 and D80 is shown. Measurements were made at 25 mM K+, pH 7.5, and temperature of 0–10 °C. (A) The experimentally derived sideband intensities from slow magic-angle spinning spectra (black) are shown together with the best fit from SPINEVOLUTION (red). The error bars represent the average signal:noise of the spectrum. (A, Right) The simulated tensors based on the average values of a protonated (dark) and deprotonated (light) carboxyl are shown. The principle components of the chemical shift tensors of E71, D80, and two other control residues (A32 and E51) were derived from these fits and are listed in C. The errors reflect the standard deviation in the values obtained from the fit. (B) Plots the distribution of the δ11 component from a previously published database (22) of protonated (dark) and deprotonated (light) carboxyl tensors of known crystal structure. Our measured δ11 values for E71, D80, and E51 are overlaid in red onto this distribution. (The y-offset of E51 is for clarity.) From the data it is very clear that E71 is protonated and D80 and E51 are both deprotonated at neutral pH.

