Fig. 1.
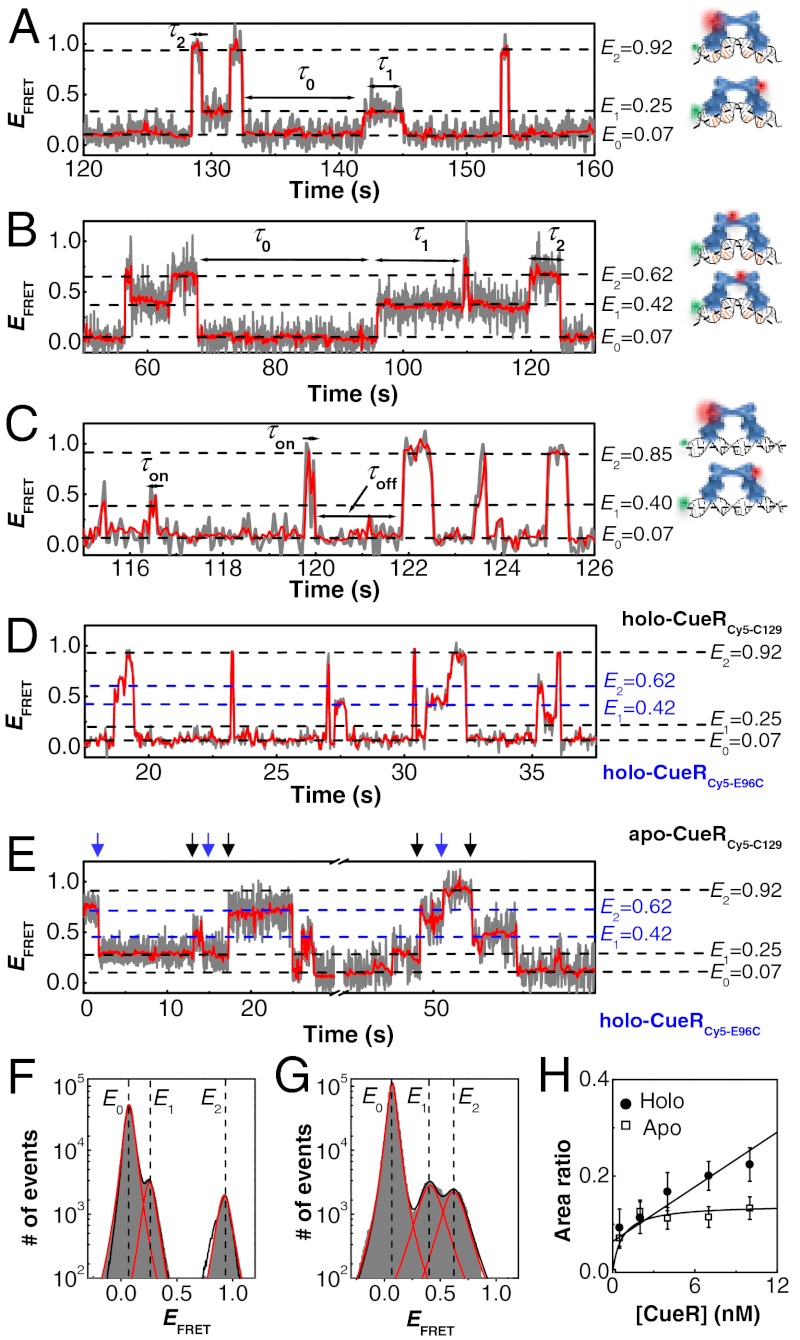
Dynamic CueR–DNA interactions. (A) Single-molecule EFRET trajectory of an immobilized Cy3-DNA interacting with holo-CueRCy5-C129 (2 nM). The cartoons on the right show CueRCy5-C129 in two binding orientations. The FRET donor (green sphere) and acceptor (red sphere) are drawn on the DNA and protein at their approximate locations. The gray line is original data; the red line is after nonlinear filtering. (B) Same as A, but with 2 nM holo-CueRCy5-E96C. (C) Same as A, but using the nonspecific DNA and 4 nM holo-CueRCy5-C129. Here, τ0 is denoted as τoff, and τ1 and τ2 are denoted together as τon. (D) Same as A, but with a mixture of holo-CueRCy5-C129 and holo-CueRCy5-E96C of 5 nM each. (E) Same as A, but with a mixture of apo-CueRCy5-C129 and holo-CueRCy5-E96C of 5 nM each. The blue arrows denote the transitions from the holo-protein bound states to the apo-protein bound states, and the black arrows denote the reverse transitions. (F) Histogram of EFRET trajectories of holo-CueRCy5-C129–DNA interactions at [holo-CueRCy5-C129] = 2 nM. Compiled from > 500 EFRET trajectories. Solid lines are fits of Voigt functions centered at about 0.07, 0.25, and 0.92, with percentage peak areas of 90.5 ± 0.1%, 4.9 ± 0.3%, and 4.6 ± 0.3%, respectively. Bin size, 0.01. (G) Same as F, but with 2 nM holo-CueRCy5-E69C. The three peaks center at about 0.07, 0.42, and 0.62, with percentage peak areas of 89.5 ± 0.1%, 5.5 ± 0.3%, and 5.0 ± 0.3%, respectively. (H) [CueRCy5-C129] dependence of the (E2 + E1)/E0 peak area ratios obtained from data such as in F. The solid lines are fits with Eqs. 8 (holo) and 9 (apo) (see also SI Appendix, section S15).

