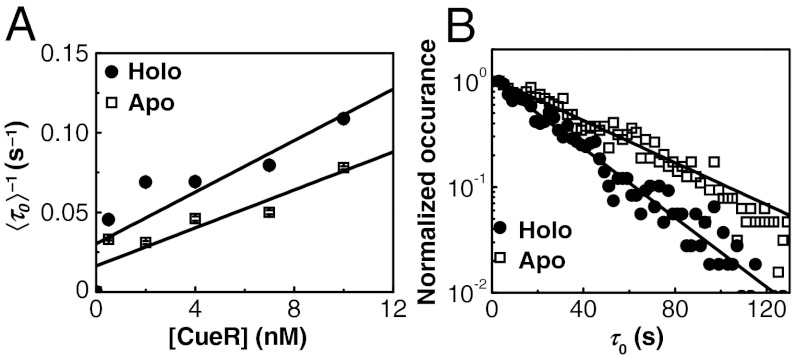
Fig. 2.
Single-step protein binding kinetics. (A) [CueR] dependence of  for CueRCy5-C129–DNA interactions. Solid lines are fits with Eq. 5 (see also SI Appendix, section S12). (B) Distributions of τ0 for holo- and apo-CueRCy5-C129 interactions with DNA, both at 0.5 nM protein concentration. Data compiled from about 500 (holo) and 600 (apo) EFRET trajectories. Bin size, 2 s. Both distributions were normalized to the first point for comparison. Solid lines are fits with a single exponential function Nγ exp(-γτ); γ(holo) = 0.038 ± 0.002 s-1, γ(apo) = 0.031 ± 0.004 s-1, and N is a scaling parameter.

