Fig. 1.
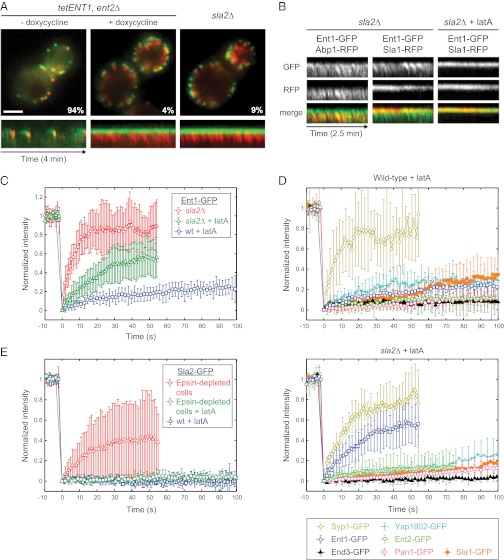
Sla2 stabilizes Ent1 at endocytic sites. (A) The uncoupling phenotype in epsin-depleted and sla2∆ cells. (Upper) Merged images of Sla1-GFP and Abp1-RFP in epsin-depleted (tetENT1, ent2∆) and sla2∆ strains are shown. The images of the epsin-depleted strain were taken before (− doxycycline) and after (+ doxycycline) the depletion of Ent1. The percentage of endocytic patches internalized during 4-min movies is shown for each strain. (Lower) Kymographs of Sla1-GFP and Abp1-RFP at endocytic patches of indicated strains. (Scale bar: 2 μm.) (B) Ent1 colocalizes with both the actin tails and the endocytic coat in sla2∆ cells. Kymographs of Ent1-GFP and Abp1-RFP or Ent1-GFP and Sla1-RFP at endocytic patches in sla2∆ cells treated or untreated with latA are shown as separate channels and merged images. (C) FRAP of Ent1-GFP at endocytic sites in latA-treated wild-type cells, latA-treated sla2∆ cells, and sla2∆ cells. The recovery curves represent the mean ± SD (n = 9–11 separate measurements). (D) FRAP analyses of the endocytic proteins Yap1802, Ent2, End3, Pan1, Sla1, and Syp1 at endocytic sites in latA-treated wild-type (Upper) and sla2∆ (Lower) cells. The curves represent the mean ± SD (n = 6–12). The recovery curves of Ent1-GFP photobleached under the same experimental conditions (from C) are shown for comparison. (E) FRAP of Sla2-GFP at endocytic sites in latA-treated wild-type cells, latA-treated epsin-depleted cells, and epsin-depleted cells. The recovery curves represent the mean ± SD (n = 5–12).

