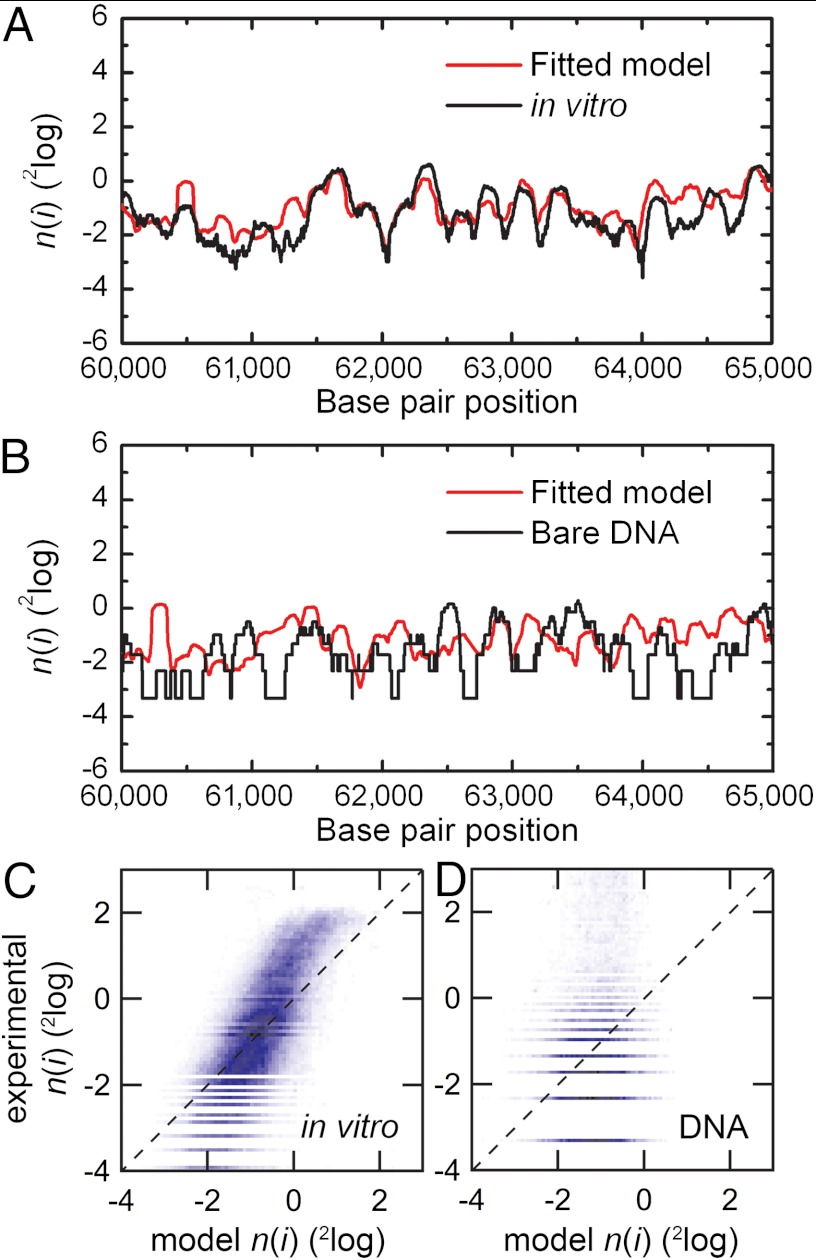
Fig. 4.
Comparison of the fitted nucleosome occupancy with genome-wide nucleosome occupancy obtained after in vitro nucleosome reconstitution and with data obtained after mock reconstitution (Materials and Methods). (A) Logarithmic plot of the nucleosome occupancy with respect to the dyad position on the DNA sequence of a part of chromosome XII on yeast DNA after in vitro reconstitution of histone octamers (black line) and our model (red line). A value greater than 0 indicates an affinity for nucleosome formation, whereas a value lower than 0 indicates nucleosome depletion with respect to the overall binding occupancy of the entire genome. The obtained values for the dinucleotide periodicity and the chemical potential are summarized in Table 1. (B) Same as A, comparing the dinucleotide model to the data obtained from bare DNA. (C) A density dot plot comparison of the entire chromosome. The color of each point represents the number of bp that map to that point in the graph. The Pearson correlation coefficient between the maps is indicated in Table 1. The dashed line in Fig. 4 C and D indicates a perfect agreement between the experimental and modeled data. Note that the experimental data was not renormalized; renormalization can change the slope of the correlation plot to unity. (D) Comparing the dinucleotide model to experimental data obtained in parallel to A but using mock-reconstituted (bare) DNA, showing that systematic experimental errors such as MNase sequence preferences or PCR bias cannot account for the high correlation between our model and the experimental nucleosome occupancy data.

