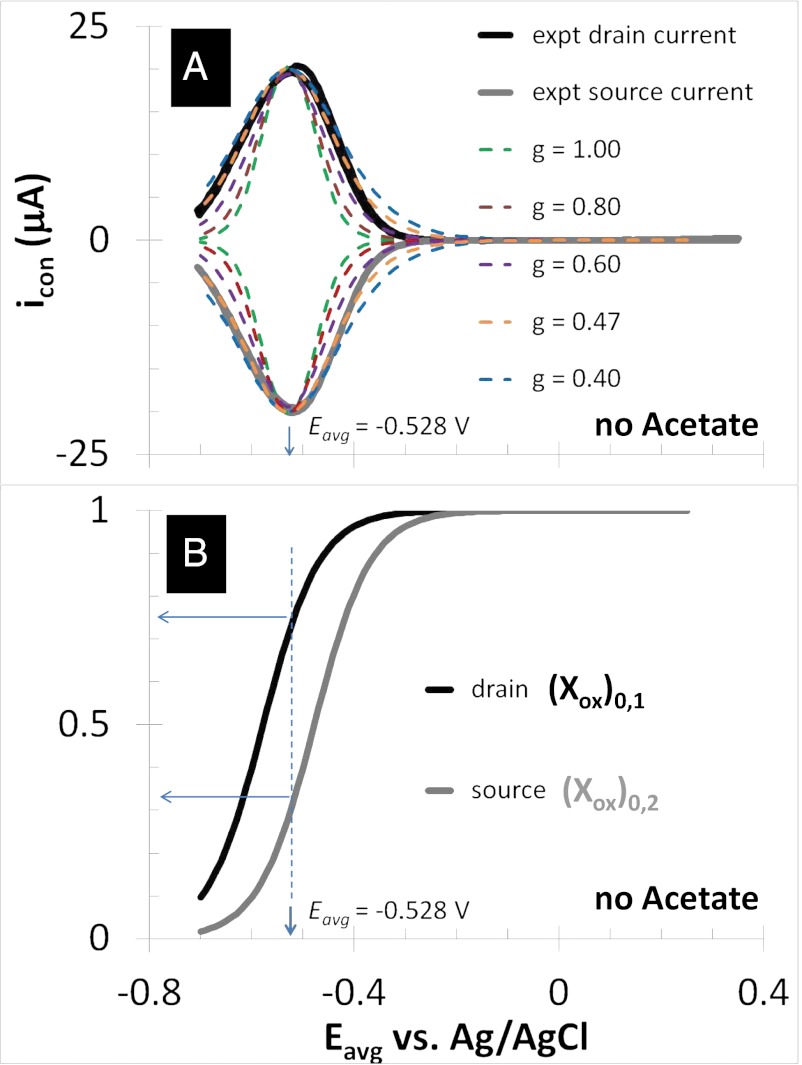
Fig. 4.
Electrochemical gate experiment recorded under nonturnover condition (no acetate present). (A) Conducted current,  vs. average potential applied to electrodes 1 and 2,
  . Electrode potentials were scanned at 0.002 V/s while maintaining electrode 2 (electron source) at a fixed −0.100 V offset vs. electrode 1 (electron drain). Fits are based on Eq. 3. (B) The corresponding plot of
  and
and  vs.
vs.  was calculated using Eq. 2. Arrows indicate the condition when difference between
  and
and  is the greatest, resulting in the largest value of
  .
.

