Fig. 3.
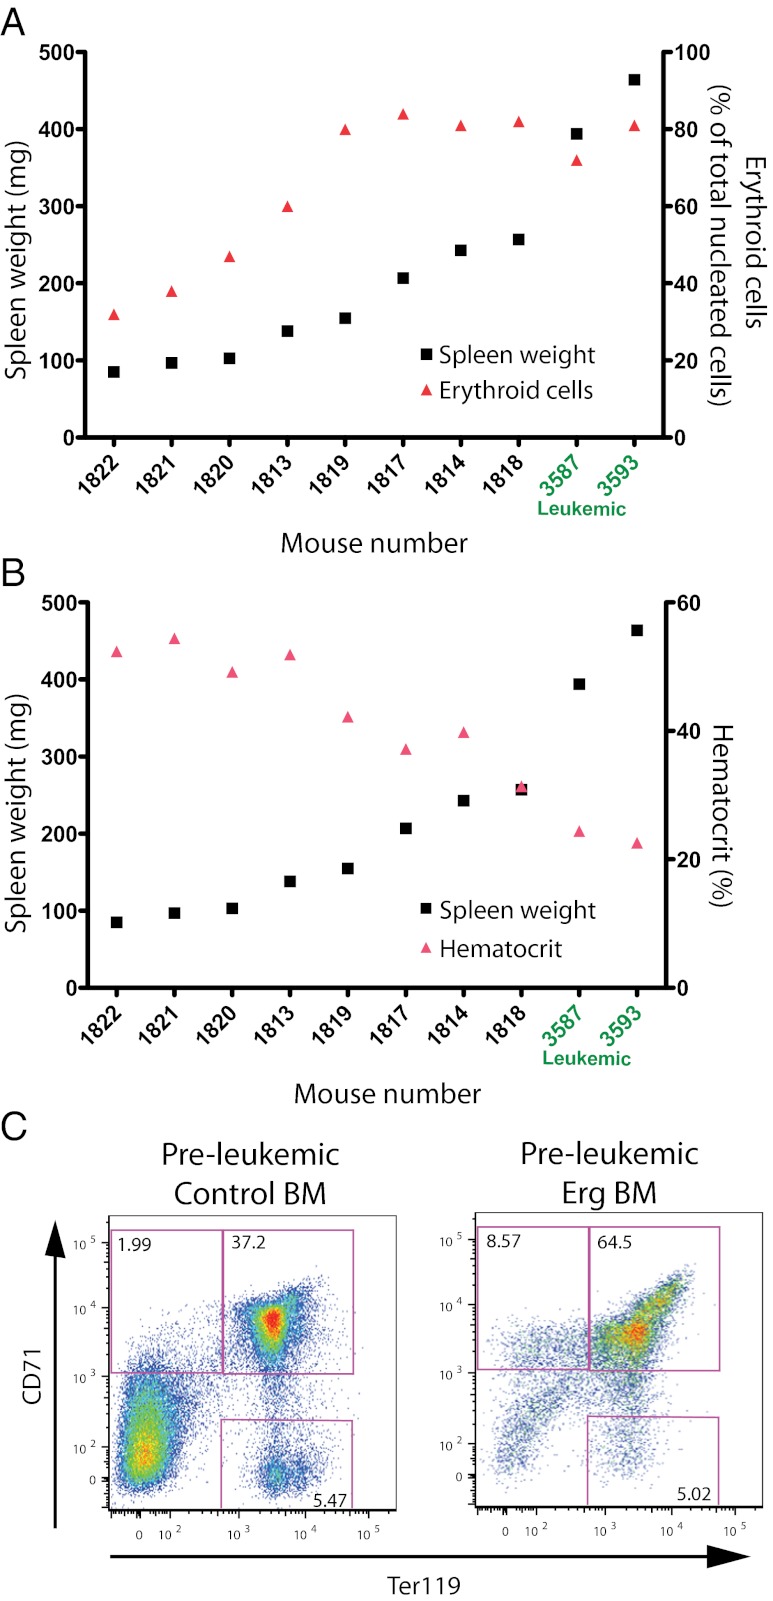
Impact of Erg overexpression on the preleukemic state. (A) Comparison of spleen weight and proportion of erythroid cells in preleukemic mice. In preleukemic mice, increasing spleen weight (black squares) correlated with increasing proportions of splenic erythroid cells (red triangles). Individual mouse numbers are shown on the x axis and are plotted in order of increasing spleen weight. Mice 3587 and 3593 (written in green) were leukemic mice and are shown for comparison. Spleen weight is shown on the left y axis, and proportion of erythroid cells is shown on the right y axis. (B) Comparison of spleen weight and hematocrit in preleukemic mice. In preleukemic mice, the hematocrit (red triangles) progressively decreased as spleen weight (black squares) increased. Individual mouse numbers are shown on the x axis and are plotted in order of increasing spleen weight. Mice 3587 and 3593 were leukemic mice and are shown for comparison. Spleen weight is shown on the left y axis, and hematocrit is shown on the right y axis. (C) Flow cytometric analysis of erythroid development in preleukemic and control bone marrow. Preleukemic mice displayed signs of perturbed erythroid development as early as 2 wk posttransplant. Flow cytometric analysis of bone marrow cells from a representative preleukemic and control mouse pair killed at 6 wk posttransplant is shown.

