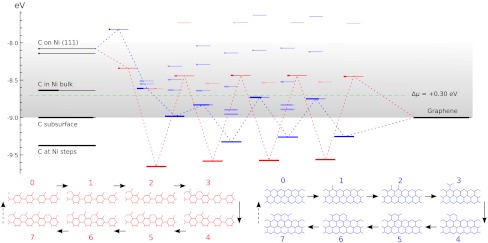
Fig. 2.
The nanoreactor diagram for A5’ and Z edges growth on Ni substrate. Carbon atoms migrate from the source (metal substrate, leftmost levels) to the product (graphene, rightmost) by sequentially populating energy levels in the middle that represent energies of nth carbon atom at the extending row already containing n - 1 atoms. (The occupancies at kT = 0.1 eV are marked by thicker segments.) Lowest-energy atomic configurations are shown in the bottom. The green line sets the chemical potential μ of carbon atoms (established by the feedstock gas). An animated version of Figs. 2–4 is provided as Movie S1.

