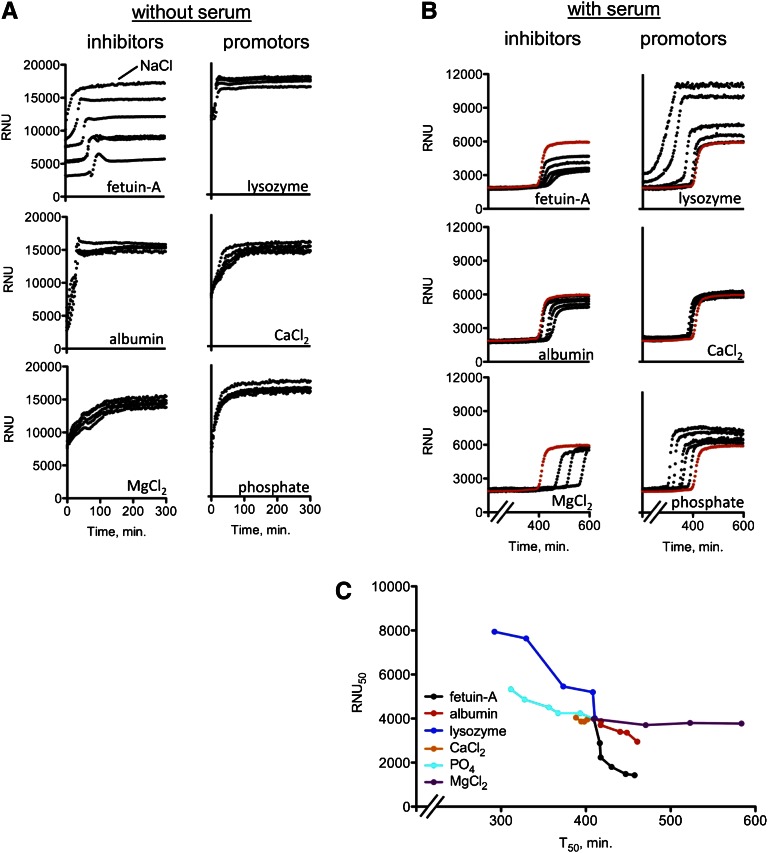
Figure 4.
Impact of selected serum components on test readout. (A) Nephelometry assay in the absence of serum. Spiking with fetuin-A delayed the transition from primary to secondary CPPs. and decreased RNU. NaCl indicates a reference precipitation curve without spiking. (B) Nephelometry assay in the presence of serum. Note that fetuin-A, albumin, and magnesium inhibited and lysozyme, phosphate, and calcium promoted precipitation. The red, nonspiked reference curve is the pooled serum from healthy volunteers. (C) Alternative presentation of T50 and RNU50 values taken from Figure 4B. Minerals mainly influence T50, whereas proteins influence both T50 and RNU50. Quantities spiked in A and B: fetuin-A: 0.0625, 0.125, 0.25, 0.375, and 0.5 g/L (normal serum concentration is about 0.5 g/L); albumin: 3.125, 6.25, 12.5, 25, and 50 g/L (normal serum concentration is 35–52 g/L); lysozyme: 3.125, 6.25, 12.5, 25, and 50 g/L (normally not present in serum); Ca2+: 0.25, 0.75, 1.0, 1.5, and 2.0 mmol/L (normal serum concentration is 2.1–2.55 mmol/L); PO4: 0.25, 0.75, 1.0, 1.5, and 2.0 mmol/L (normal serum concentration is 0.84–1.45 mmol/L); Mg2+: 0.25, 0.5, and 0.75 mmol/L (normal serum concentration is 0.75–1.0 mmol/L).

