Abstract
Exposure of proximal tubular epithelial cells to high glucose contributes to the accumulation of tubulointerstitial and matrix proteins in diabetic nephropathy, but how this occurs is not well understood. We investigated the effect of the signaling molecule tuberin, which modulates the mammalian target of rapamycin pathway, on renal hypertrophy and fibronectin expression. We found that the kidney mass was significantly greater in partially tuberin-deficient (TSC2+/−) diabetic rats than wild-type diabetic rats. Furthermore, TSC2+/− rats exhibited significant increases in the basal levels of phospho-tuberin and fibronectin expression in the kidney cortex. Increased levels of phosphorylated tuberin associated with an increase in fibronectin expression in both wild-type and TSC2+/− diabetic rats. Treatment with insulin abrogated the diabetes-induced increase in fibronectin expression. In vitro, high glucose enhanced fibronectin expression in TSC2+/− primary proximal tubular epithelial cells; both inhibition of Akt and inhibition of the mammalian target of rapamycin could prevent this effect of glucose. In addition, forced expression of tuberin in tuberin-null cells abolished the expression of fibronectin protein. Taken together, these data suggest that tuberin plays a central role in the development of renal hypertrophy and in modulating the production of the matrix protein fibronectin in diabetes.
Diabetic nephropathy (DN) is characterized by glomerular, vascular, and tubulointerstitial lesions that culminate in fibrosis and loss of renal function.1–3 It is now widely accepted that the rate of deterioration of kidney function shows a strong correlation with the degree of tubulointerstitial fibrosis.2 Tubular cells are primary targets of hyperglycemia, and chronic exposure to elevated blood glucose levels contributes to the tubulointerstitial changes seen in overt diabetic nephropathy.2–4 Proximal tubular epithelial cells exposed to high glucose (HG) concentrations undergo hypertrophy and accumulate matrix proteins such as fibronectin and collagen.5 Accumulation of cell matrix proteins in diabetes leads to thickening of glomerular and tubular basement membranes of the kidney.5–7 Tuberin, a central signaling molecule, has recently been identified as a direct substrate of Akt.8,9 Akt is known to phosphorylate tuberin on threonine (Thr1462), resulting in its inactivation.10 The PI3-K/Akt pathway is activated in diabetes and there is evidence that this is redox dependent.11 Activated Akt phosphorylates tuberin at specific residues, resulting in its dissociation from hamartin and degradation/inactivation.12 Deficiency or inactivation of tuberin through phosphorylation on specific residues results in the activation of the mammalian target of rapamycin (mTOR) pathway and downstream signaling to enhance mRNA translation.11,12
Tuberin is an important signaling protein that is intimately involved in protein translation through regulating the mTOR pathway.13–15 mTOR phosphorylates and activates p70S6K ribosomal protein S6 kinase on Thr389.16 Activation of p70S6K and its subsequent phosphorylation of ribosomal protein S6 are required for biosynthesis of the cellular translational apparatus, a critical component for cell growth.9,15,16 The central role of S6K and ribosomal protein S6 has been further demonstrated by the use of rapamycin, a macrolide that specifically and directly inhibits mTOR, an obligate upstream activator of p70S6K, and results in 4E-BP1 phosphorylation and increased expression of eIF4E.17
The mechanisms by which hyperglycemia contributes to matrix expansion and fibrosis are not fully known. Although strict metabolic control prevents many of the complications of diabetes, it is often difficult to achieve. Therefore, understanding the mechanism by which glucose exerts its deleterious effects will help in the design of adjunct therapy to treat diabetic complications including nephropathy. In this study, we investigated the mechanisms by which tuberin regulates cell matrix protein using wild-type (TSC2+/+) and partially tuberin-deficient (TSC2+/−) renal primary proximal tubular epithelial cells (PPTECs) exposed to HG as well as in kidney cortex of type 1 diabetic wild-type and TSC2+/− rats.
Results
Kidney Hypertrophy Associated with Tuberin Deficiency Is Further Elevated by Diabetes
Using the kidney/body weight ratio as a marker of renal hypertrophy, we compared kidneys from untreated TSC2+/− rats with those from age-, sex-, and strain-matched wild-type controls. Kidneys from TSC2+/− rats were significantly larger in mass (27%) than kidneys from wild-type rats at the age of 1 month (Table 1). Kidneys from TSC2+/− rats were free from cysts and tumors when examined histologically. Albuminuria and creatinine clearance were also higher in TSC2+/− rats compared with wild-type rats (Table 1). In addition, albuminuria was significantly increased in diabetic TSC2+/− rats compared with wild-type diabetic rats. Furthermore, creatinine clearance as an index of GFR was significantly decreased in diabetic TSC2+/− and wild-type rats compared with control rats (Table 1). These data indicate that under basal conditions, partial tuberin deficiency is associated with altered kidney function, suggesting that tuberin is a major signaling intermediate molecule controlling kidney size and protein synthesis. Diabetes increased kidney hypertrophy in TSC2+/− rats to levels higher than those seen in wild-type rats (Table 1). Insulin treatment reversed these changes almost to the control levels in diabetic wild-type animals. However, in diabetic TSC2+/−rats, treatment with insulin markedly reduced kidney weights so that they were significantly lower than those in the control TSC2+/− rats and equivalent to the control levels of the wild-type rats (Table 1). Thus, insulin treatment not only blocked the effects of the streptozotocin-induced diabetes, but also appeared to reverse the basal hypertrophy associated with partial deficiency in tuberin (TSC2+/−) (Table 1).
Table 1.
Physiologic and kidney function parameters in control rats as well as diabetic rats and diabetic wild-type and partially tuberin-deficient (TSC2+/−) rats treated with insulin
| Parameter | Controls | Diabetic TSC2+/+ Rats | Controls | Diabetic TSC2+/− Rats | ||
|---|---|---|---|---|---|---|
| Streptozotocin Treatment | Streptozotocin and Insulin Treatment | Streptozotocin Treatment | Streptozotocin and Insulin Treatment | |||
| Blood glucose (mg/dl) | 108±5.9 | 426.8±49.3a | 83±30.4 | 110±10.5 | 482.8±68.3a | 113±6.1 |
| Body weight (g) | 391.7±22.7 | 284.0±9.6a | 391.3±11 | 375.5±19.5 | 275±16.1a | 380±14.3 |
| Kidney weight (g) | 2.51±0.17 | 3.33±0.25a | 2.97±0.13 | 3.18±0.16b | 4.0±0.39a,c | 2.5±0.15d |
| Kidney/body weight (g/g) ratio (%) | 0.65±0.04 | 1.16±0.07a | 0.76±0.05 | 0.83±0.05b | 1.45±0.08a,c | 0.66±0.03d |
| Albuminuria (mg protein/24 h) | 2.1±0.1 | 3.48±0.3a | 1.9±0.2 | 2.9±0.2b | 6.5±1.3a,c | 2.3±0.4 |
| Creatinine clearance (ml/min/kg) | 1.7±0.1 | 1.0±0.1a | 0.5±0.4d | 4.32±0.9b | 2.36±0.5a,c | 1.1±0.6d |
Tuberin deficiency significantly increases kidney hypertrophy, albuminuria, and creatinine clearance compared with wild-type rats. Partial deficiency in tuberin is associated with renal hypertrophy. Kidneys were harvested from wild-type and TSC2+/− rats. Kidney/body weight ratios, albuminuria, and creatinine clearance are significantly (P<0.05) higher in TSC2+/− rats compared with wild-type animals. Rats injected with buffer (controls), streptozotocin, or streptozotocin and insulin were sacrificed 4 weeks after diabetes was induced, and kidneys dissected and kidney/body weight ratios determined. Diabetes further increased the kidney/body weight ratios and albuminuria, and decreased creatinine clearance in TSC2+/− more than in TSC2+/+ rats and insulin treatment of diabetic animals normalized kidney/body weight and albuminuria.
P< 0.01, significant difference from control animals to diabetic animals.
P<0.05, significant difference between controls of the TSC2+/+ and TSC2+/− rats.
P<0.05, significant difference between diabetic TSC2+/+ and TSC2+/− rats.
P<0.05, significant difference between controls rats and the group of insulin-treated diabetic rats.
Tuberin Deficiency Is Associated with Increased Cellular Content of Phosphorylated Akt, Tuberin, and p70S6K and Expression of Fibronectin
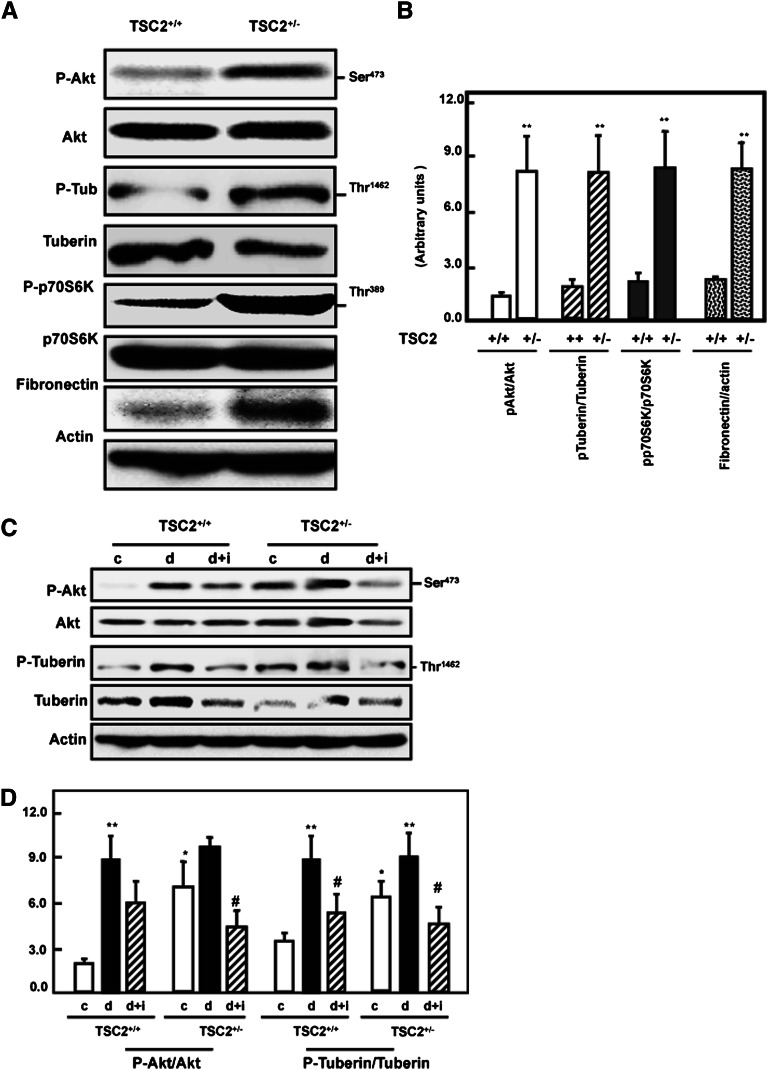
To investigate the effect of partial deficiency of tuberin on the activation of some intermediates of the mTOR pathway, kidney cortex homogenates of wild-type and TSC2+/− rats were analyzed by immunoblotting. Cellular levels of Akt and p70S6K appeared to be similar in both rat strains; however, both showed significantly increased phosphorylation/inactivation in the TSC2+/− rats (Figure 1, A and B). Furthermore, although total tuberin was reduced in the TSC2+/− strain, there were higher levels of tuberin phosphorylation at Thr1462 compared with wild-type rats (Figure 1, A and B). The increased phosphorylation of tuberin probably resulted in the activation of mTOR. A large increase in the renal levels of fibronectin was also observed in the TSC2+/− rats. This is consistent with both the enhanced phosphorylation of the Akt/tuberin/p70S6K pathway and the renal hypertrophy observed in this strain of animals.
Figure 1.
Tuberin deficiency is associated with enhanced phospho-Akt, phospho-tuberin, phospho-p70S6K, and fibronectin expression in the rat kidney cortex. (A) Kidney cortex from wild-type and TSC2+/− rats was analyzed by immunoblotting with the indicated antibodies. A representative blot of cortex of single wild-type and TSC2+/− rats is shown. (B) Semiquantitation of immunoblots from the animals in each group was carried out using densitometry and the data are shown as the mean ± SEM of four animals. **P<0.01, significant difference from wild-type animals. Diabetes-induced increase in Akt and tuberin phosphorylation is ameliorated by insulin. (C) Kidney cortex from control (c), streptozotocin (d), and streptozotocin plus insulin (d+i) treated wild-type (TSC2+/+) and TSC2+/− rats were analyzed by immunoblotting with the indicated antibodies. Actin was used as a loading control. (D) Semi-quantitation of immunoblots was carried out as in Figure 2C. Histograms in the bottom panel show increased phospho-Akt, and phospho-tuberin expression in TSC2+/− and wild-type diabetic animals compared with control (c) rats. **P<0.01, significant difference from control animals to diabetic animals; *P<0.05, significant difference between TSC2+/− rats to wild-type rats; #P<0.05, significant differences between diabetic rats and insulin-treated diabetic rats.
Induction of Type 1 Diabetes Increases Akt and Tuberin Phosphorylation and Results in Accumulation of Fibronectin
To investigate the effect of diabetes on tuberin and Akt phosphorylation, type 1 diabetes was induced in wild-type and TSC2+/− rats by intravenous injection of streptozotocin. Four weeks after injection, kidney homogenates were prepared and immunoblotted with antibodies against phospho-Akt (Ser473), total Akt, phospho-tuberin (Thr1462), and total tuberin. Phosphorylation of Akt and tuberin were increased in the kidney cortex of diabetic rats compared with control rats (Figure 1, C and D). These data were confirmed by immunofluorescence studies demonstrating the increased staining of p-tuberin in the kidney cortex of diabetic rats compared with control rats (Supplemental Figure 1). Treatment of diabetic rats with insulin partially resolved the increase in p-Akt and p-tuberin in wild-type rats but reduced the levels of these activated intermediates in the TSC2+/− rats to below control values (Figure 1, C and D).
Diabetes Increases mTOR Activation and Fibronectin Expression
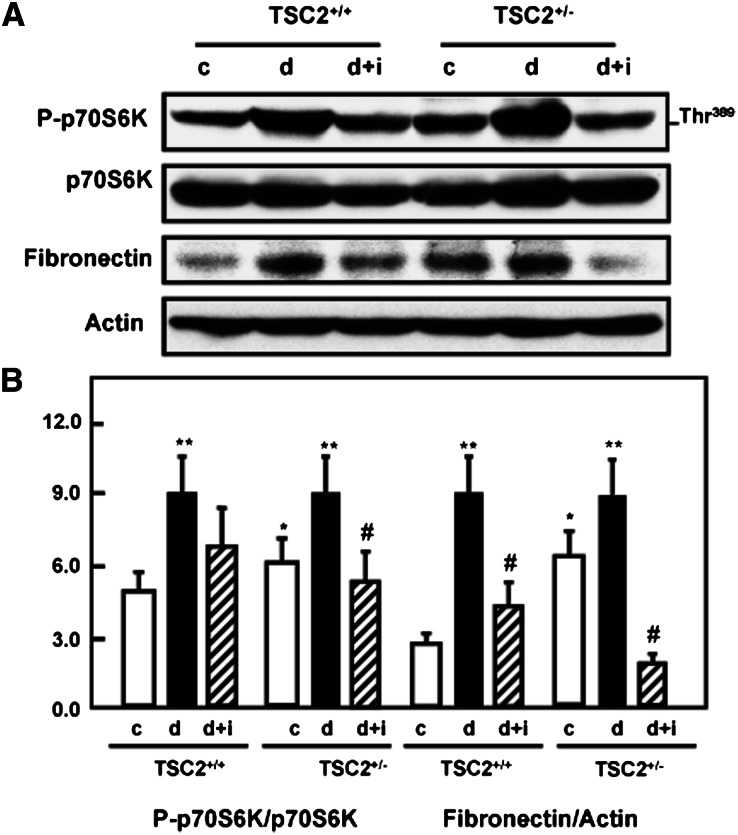
The induction of diabetes increased tuberin phosphorylation/inactivation and resulted in activation of mTOR as evidenced by the increased phosphorylation on Thr389 of p70S6K, its downstream target (Figure 2, A and B). Treatment of diabetic rats with insulin resulted in normalized mTOR activity to the control levels. Increased Akt and tuberin phosphorylation and activation of mTOR in the diabetic rats were accompanied by an increase in fibronectin protein compared with control rats. These data were supported by immunofluorescence staining of kidney sections for phospho-p70S6k (Supplemental Figure 2A) and immunoperoxidase staining for fibronectin (Supplemental Figure 2B). Immunoperoxidase staining of collagen IV was also increased in diabetic wild-type and TSC+/− rats, and insulin treatment normalized these changes to the control levels (Supplemental Figure 2C), further demonstrating the influence of diabetes on the increased expression of cell matrix proteins in the kidney cortex. In diabetic rats, the increased deposition of fibronectin and collagen IV appeared to be in and around the proximal tubules. These data indicate that Akt phosphorylation and tuberin phosphorylation/inactivation and the subsequent activation of the mTOR/S6K pathway play a role in matrix protein accumulation in the diabetic rat kidney.
Figure 2.
Diabetes activates mTOR and enhances fibronectin protein accumulation in kidney cortex of TSC2+/− and wild-type rats. (A) Diabetes enhances the phosphorylation of p70S6K at Ser473 in kidney cortex of TSC2+/− and wild-type rats compared with control (c) rats. Activation of mTOR resulted in increase of fibronectin protein expression in diabetic (d) TSC2+/− and wild-type rats. Treatment of diabetic rats with insulin (d+i) reversed the changes to control levels. Actin was used as a loading control. (B) Histograms in the bottom panel show increased phospho-p70S6K expression and fibronectin protein expression in TSC2+/− and wild-type diabetic animals compared with control rats. **P<0.01, significant difference from control animals to diabetic animals; *P<0.05, difference between TSC2+/− rats to wild-type rats; #P<0.05, differences between diabetic insulin-treated diabetic rats.
Akt Phosphorylation Is Associated with Increased Fibronectin Expression in PPTECs
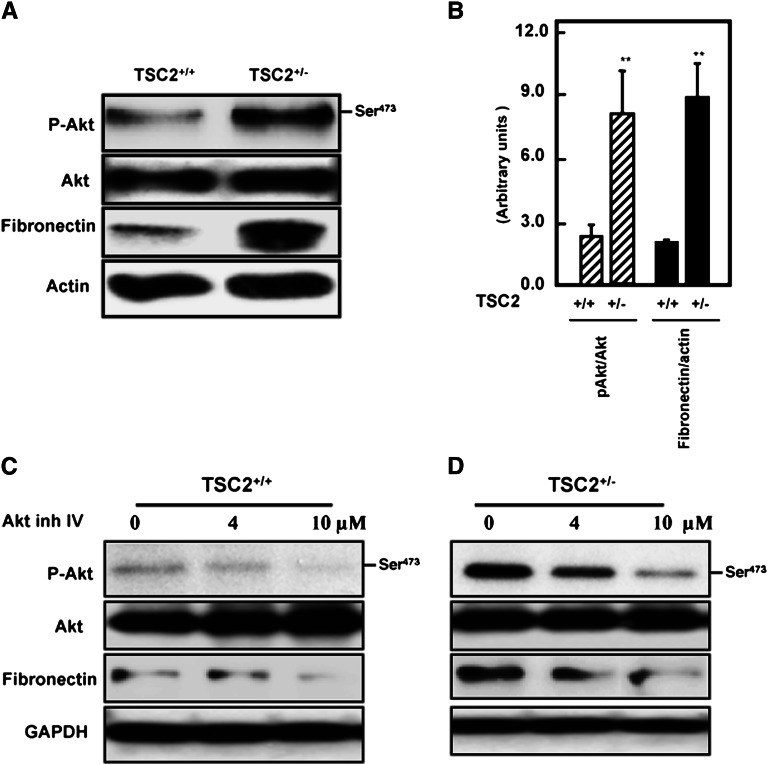
To confirm that proximal tubular cells are a potential major source of fibronectin, we isolated PPTECs from kidney cortex of wild-type and TSC2+/− rats. Cells were tested first for the expression of phospho-Akt, total Akt, and fibronectin expression by Western blot analysis. Proximal tubular cells isolated from TSC2+/− rats expressed significant levels of phospho-Akt and higher levels of fibronectin protein compared with cells isolated from kidney of wild-type animals (Figure 3, A and B). The role of Akt phosphorylation in the regulation of fibronectin protein expression was further investigated in TSC2+/+ and TSC2+/− primary proximal tubular cells by inhibition with different concentrations (0–10 µM) of Akt IV inhibitor for 24 hours. The inhibitor reduced p-Akt in a dose-dependent manner (Figure 3, C and D), and this was accompanied by a decrease in fibronectin expression. These data indicate that Akt phosphorylation plays a role in activating downstream signals that lead to increased cell matrix protein accumulation in kidney cortex.
Figure 3.
Activation of Akt results in accumulation of fibronectin in renal primary proximal tubular cells. (A) Cell lysates of primary proximal tubular cells isolated from TSC2+/− and wild-type cells were subjected to Western blot analysis. Increases in phospho-Akt are associated with increased fibronectin expression in TSC2+/− rats compared with wild-type rats. (B) Histograms represent mean ± SEM of three experiments. **P<0.01, significant difference from wild-type cells. (C and D) Inhibition of Akt blocks fibronectin expression. TSC2+/− and wild-type cells were treated with different concentrations of Akt inhibitor IV (0–10 μM) for 24 hours show a significant decrease in fibronectin protein expression. The inhibition of Akt was associated with a decrease in fibronectin expression and was dose dependent. Note that Akt phosphorylation is more prominent in cells partially deficient in tuberin (TSC2+/−) compared with wild-type cells.
Introducing Tuberin into Tuberin-Null Cells Markedly Reduces Fibronectin Expression
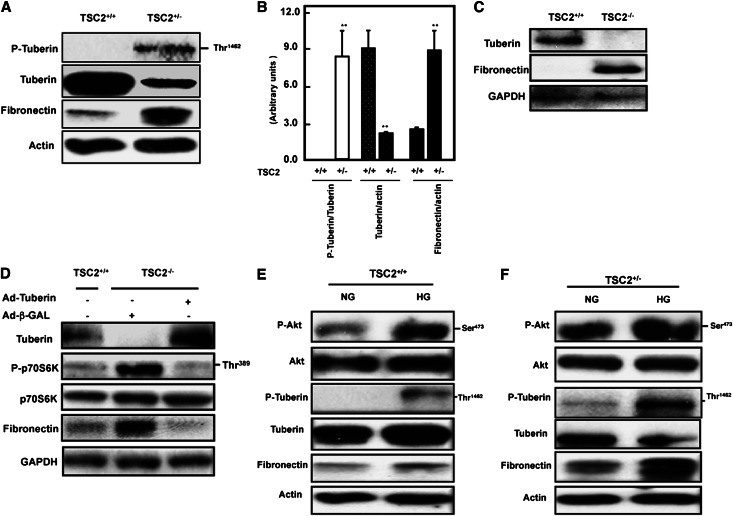
In partially tuberin-deficient proximal tubular epithelial cells (TSC2+/−) isolated from the Eker rat, there was a much higher level of tuberin phosphorylated at Thr1462 and a >50% reduction of total tuberin compared with cells from the wild-type rats. Thus, increased tuberin phosphorylation and decreased total tuberin are associated with higher expression of fibronectin protein compared with wild-type cells (Figure 4, A and B). To further investigate the link between tuberin and fibronectin expression, we used embryonic fibroblasts isolated from TSC2+/+ and TSC2−/− mice. Total loss of the TSC2 gene is embryonically lethal. Total deficiency of tuberin in the null cells was associated with a marked increase in fibronectin expression (Figure 4C). Introduction of tuberin expression in the null cells with Ad-TSC2 markedly reduced fibronectin expression (Figure 4D). We confirmed the activity of mTOR in tuberin-null cells by measuring the levels of p70S6K phosphorylation. These too were markedly reduced by the overexpression of tuberin (Figure 4D). Together, these data indicate that tuberin plays a major role in the regulation of fibronectin and in particular that the absence of tuberin leads to accumulation of extracellular matrix proteins in tubular epithelial cells.
Figure 4.
Phosphorylation or deficiency of tuberin enhances fibronectin accumulation. (A) Tuberin deficiency and increased tuberin phosphorylation is associated with a significant increase in fibronectin accumulation in primary cells compared with wild-type cells as determined by Western blot. (B) Histograms of data obtained in A. **P<0.01, significant difference from wild-type cells. Tuberin regulates fibronectin protein expression. (C) Loss of tuberin resulted in the accumulation of fibronectin protein in tuberin-deficient (TSC2−/−) cells. (D) Introduction of tuberin into TSC2−/− cells prevents accumulation of fibronectin. TSC2−/− cells were infected with an adenovirus expressing tuberin (Ad-TSC2). Adenovirus expressing β-GAL was used as a control. Lysates from these and untreated TSC2+/+ cells were used to determine tuberin, phopho-p70S6K, p70S6K, and fibronectin expression by Western blot. Glyceraldehyde 3-phosphate dehydrogenase expression serves as a loading control. HG increases the phosphorylation of Akt and tuberin in primary proximal tubular cells isolated from TSC2+/− and wild-type rats. (E and F) HG enhances the phosphorylation of Akt at Ser473 and tuberin at Thr1462 in TSC2+/− and wild-type cells compared with cells grown in NG control rats. Activation of Akt and phosphorylation of tuberin resulted in increased protein expression of fibronectin in both cells treated with HG. Notice that these changes are more prominent in cells partially deficient in tuberin (TSC2+/−) compared with wild-type cells. Note too that phosphorylated tuberin is more prominent in cells partially deficient in tuberin (TSC2+/−) compared with wild-type cells.
HG Enhances Akt and Tuberin Phosphorylation and Results in Fibronectin Accumulation in PPTECs
To investigate the effect of diabetes on tuberin function and expression of fibronectin in vitro, PPTECs isolated from the kidney cortex of wild-type and TSC2+/− rats were exposed to HG (25 mM glucose) for 24 hours. HG increased phosphorylation of Akt at Ser473 and tuberin phosphorylation at Thr1462 in both wild-type and TSC2+/− PPTECs. Increased Akt and tuberin phosphorylation was accompanied by a significant increase in fibronectin protein expression compared with cells grown in normal glucose (NG) (Figure 4, E and F). Furthermore, treatment of TSC2+/− cells with HG showed a substantial increase in fibronectin accumulation compared with wild-type cells under the same conditions (Figure 4, E and F) indicating that tuberin is a major regulator of cell matrix protein.
Fibronectin Protein Expression Is Regulated through mTOR and Blocked by Rapamycin
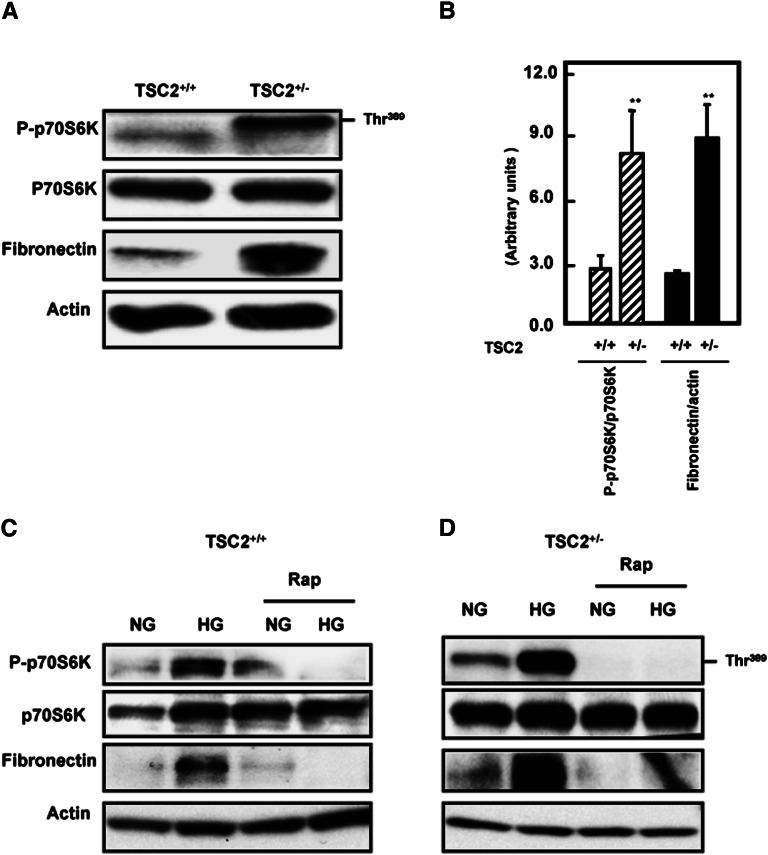
Because tuberin is a major negative regulator of mTOR, we investigated the role of mTOR in HG-induced fibronectin expression. Initially, wild-type and TSC2+/− rat PPTECs were tested for the expression of phospho-p70S6K as a major downstream target that determines mTOR activity. Cells isolated from TSC2+/− rats expressed significant levels of phospho-p70S6K and higher levels of fibronectin protein compared with cells isolated from kidney of wild-type animals (Figure 5, A and B).
Figure 5.
Activation of mTOR significantly increased fibronectin expression in TSC2+/− cells compared with wild-type cells. (A and B) TSC2+/− cells show a significant increase in mTOR activity and fibronectin protein compared with wild-type cells. **P<0.01, significant difference from wild-type cells. Inhibition of mTOR activity by rapamycin decreases HG-induced fibronectin expression. (C and D) TSC2+/− and wild-type primary cells pretreated with rapamycin for 24 hours before exposure to HG for 24 hours show a significant decrease in fibronectin expression compared with nontreated cells or cells grown in NG.
In cells treated with HG, there was a significant increase in p70S6K phosphorylation compared with cells grown in NG, and mTOR activity was higher in TSC2+/− cells compared with wild-type cells (Figure 5, C and D). Furthermore, HG induced a marked increase in fibronectin in both cell types. To confirm the effect of mTOR on HG-induced fibronectin expression, cells were treated with HG and the mTOR inhibitor rapamycin for 24 hours. Treatment of the cells with a low dose of rapamycin (20 nM) blocked both p70S6K phosphorylation and the increase in fibronectin expression induced by exposure to HG (Figure 5, C and D). These data indicate that mTOR activation is a major downstream target of Akt and tuberin in the regulation of fibronectin expression and modulates the increase seen in HG conditions.
HG-Induced Fibronectin mRNA Expression and Fibronectin Promoter Activity Is Inhibited by Rapamycin
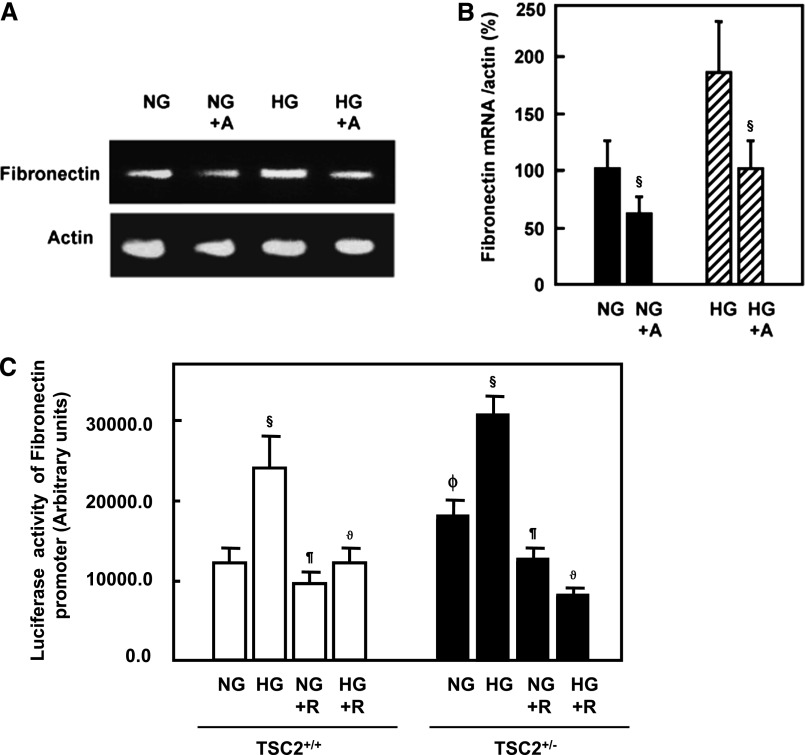
To investigate whether HG regulates fibronectin at the transcriptional level, rat PPTECs were treated with actinomycin D before exposure to HG for 24 hours. Actinomycin D reduced the fibronectin mRNA levels induced by HG (Figure 6, A and B). These data suggest that HG induces transcription of fibronectin. We investigated the effect of HG and rapamycin on the activity of a fibronectin promoter/reporter construct transfected into PPTECs. Exposure of the transfected cells to HG significantly increased fibronectin promoter reporter activity (Figure 6C), implicating transcription as a mechanism in HG-induced fibronectin protein expression. The inhibition of mTOR with rapamycin blocked these HG-induced changes, strongly suggesting that the mTOR pathway is required not only for HG translational effects on matrix accumulation but also for its transcriptional effects.
Figure 6.
HG regulates mRNA of fibronectin expression. (A) Tubular epithelial cells pretreated with actinomycin D (50 μM) before exposure of the cells to HG (HG+A). Total RNA from tubular cells grown in normal or HG and pretreated with and without actinomycin D was extracted and subjected to RT-PCR. Products were separated on agarose gel electrophoresis and visualized by ethidium bromide staining under ultraviolet light. (B) Intensity of each band was quantified by densitometry. Histograms represent mean ± SEM (n=3). §P<0.01, significant difference from cells treated with NG or HG. Blocking mTOR activity significantly reduced the promoter activity of fibronectin in primary cells. (C) Rapamycin prevents HG-induced increase in fibronectin promoter transcriptional activity in TSC2+/+ and TSC2+/− PPTECs. A reporter plasmid containing the fibronectin promoter driving expression of the luciferase and a control Renilla reporter gene were co-transfected into the cells using Lipofectamine Plus Reagent. After treatment with rapamycin and HG for 24 hours, the cells were washed with PBS and cell lysates were prepared. Luciferase activity was determined using the Luciferase Reporter Assay System by a luminometer and normalized by Renilla reporter activity. Histograms represent mean ± SEM (n=3). §P<0.01, significant differences between NG and HG; ¶P<0.01, differences in rapamycin-treated cells and nontreated cells; ϑP<0.01, differences in HG+R and HG; and ϕP>0.01, differences in TSC2+/− cells and TSC2+/+ cells.
Discussion
We provide the first experimental evidence that tuberin plays a central role in the regulation of the cell matrix protein fibronectin in diabetes. We show that tuberin deficiency or inactivation by phosphorylation is associated with enhanced renal hypertrophy in normoglycemic rats and this is enhanced by streptozotocin-induced diabetes. Our data also show that tuberin deficiency or inactivation increases fibronectin expression in kidney cortex of type 1 diabetic rats. In addition, mTOR activation increases fibronectin and collagen IV accumulation in diabetic rats, whereas insulin treatment reversed these changes to the control levels. We show also that Akt phosphorylation is associated with an increase in fibronectin expression and inhibition of Akt activity blocked fibronectin accumulation. We confirmed the central role of tuberin in fibronectin regulation by introducing tuberin into tuberin-deficient cells and found that fibronectin was significantly decreased. We show also that HG enhanced mTOR activity and rapamycin blocked fibronectin accumulation in cells treated with HG. In addition, rapamycin blocked fibronectin accumulation in partially tuberin-deficient mice (data not shown). We further demonstrate that HG regulates mRNA of fibronectin expression and blockade of mTOR with rapamycin prevents the HG-induced increase in fibronectin promoter transcriptional activity.
Tuberin is a direct substrate of Akt in Drosophila and in human cells. In Drosophila, tuberin deficiency causes an increase in eye cell size.18 Here, we found that kidneys from rats and mice (mice data not shown) partially deficient in tuberin have a larger mass than kidneys from wild-type rats, suggesting that tuberin is a central molecule in regulating kidney hypertrophy via modulation of protein synthesis and the associated translational pathway. In diabetes, the renal tubule is subject to both direct and indirect insults. Tubular and interstitial lesions are prominent in diabetic patients.19 In a number of cells, HG promotes an increase in Akt phosphorylation.10,20 Akt activation phosphorylates tuberin on specific residues (Thr1462) in both HG-treated cells and in kidney cortex of the type 1 diabetic rat.11 In addition, tuberin deficiency or inactivation by phosphorylation increases fibronectin expression in kidney cortex of type 1 diabetic rats. Phosphorylation of tuberin by Akt affects its function through at least two mechanisms: first, phosphorylation decreases the activity of tuberin; second, phosphorylation destabilizes tuberin by disrupting the complex formation between hamartin and tuberin resulting in ubiquitination of free tuberin and its degradation by the proteosome.8–10 Enhanced phosphorylation of tuberin results in the activation of the mTOR pathway with accumulation of fibronectin in kidney cortex of diabetic rats, suggesting that inactivation of tuberin and activation of mTOR together regulates cell matrix proteins. Immunofluorescence studies confirmed the increase of tuberin and p70S6K phosphorylation in proximal tubular epithelial cells in response to diabetes. In diabetic rats treated with insulin, tuberin and p70S6K phosphorylation were restored to control levels. In addition, treatment of diabetic rats with insulin normalized fibronectin and collagen IV staining to control levels. These data indicate that inactivation or reduction of tuberin and the subsequent activation of the mTOR/S6K pathway play a central role in regulation the matrix accumulation in diabetic kidney.
The role of Akt phosphorylation in the regulation of fibronectin protein expression was further investigated in rat TSC2+/+ and TSC2+/− primary proximal tubular cells. Inhibition of Akt by Akt IV inhibitor reduced the activity of Akt and this was accompanied by a decrease in fibronectin expression, suggesting that Akt phosphorylation plays a role in activating downstream signals that lead to increased cell matrix protein accumulation in kidney cortex. We also confirmed the central role of tuberin in fibronectin regulation by introducing tuberin into mouse tuberin-null cells that express higher levels of fibronectin compared with wild-type–derived cells, and found that fibronectin expression was abolished. To note, a previous study reported that fibroblasts derived from tuberous sclerosis skin lesions expressed higher levels of fibronectin protein compared with normal cells.21
Akt-mediated phosphorylation of tuberin enhances the ability of tuberin to act as a Rheb-GTPase, and therefore activates mTOR under conditions of HG concentration in cells as well as in kidney cortex of diabetic rats.11,22 The Akt/mTOR pathway is thought to regulate fibronectin by two distinct methods, by controlling fibronectin protein levels as well as by influencing alternative splicing of the extra type III domain A of cellular fibronectin.23 Inhibition of mTOR by rapamycin resulted in downregulation of several cell matrix proteins expression including fibronectin, collagen and α-SMA in skin cells.24
The regulation of tuberin is an important step in fibronectin accumulation in diabetic rats, whereas insulin treatment reversed these changes to the control levels. In addition, HG enhances mTOR activity and resulted in increased fibronectin protein expression. Inhibition of mTOR by rapamycin significantly decreased fibronectin accumulation in cells. Rapamycin also blocked the HG-induced increase in fibronectin promoter transcriptional activity, strongly suggesting that the mTOR pathway is required not only for the translational effects of HG on matrix accumulation but also for its transcriptional effects. Our laboratory is currently investigating the mechanisms of transcriptional regulation and identification of the transcription factor(s) involved in accumulation of cell matrix proteins by HG.
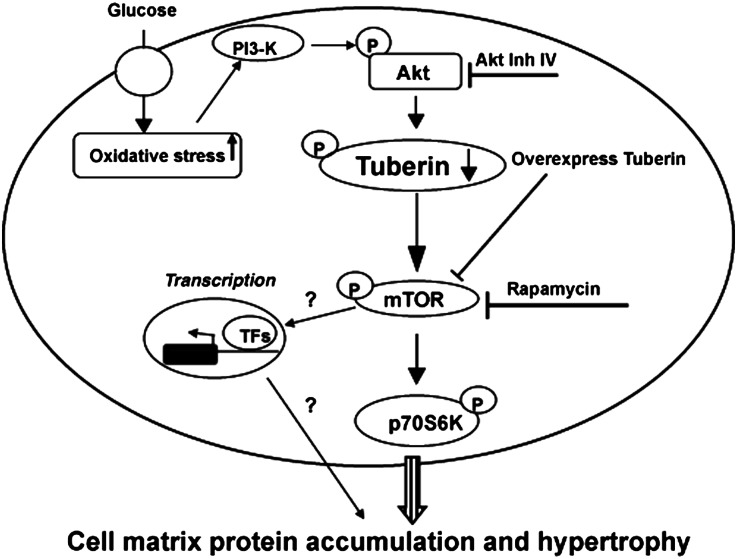
In summary, our data indicate that tuberin plays a central role in regulation cell matrix proteins in the diabetic kidney. These data indicate that tuberin is a major molecule in the induction of kidney hypertrophy and cell matrix proteins by modulating protein synthesis (Figure 7). We found that tuberin inactivation or deficiency is responsible for the increased fibronectin expression in kidney cortex of diabetic rats and these findings were confirmed in PPTECs isolated from kidney cortex of rats exposed to HG. These data provide strong evidence for the role of tuberin in regulating downstream effectors that are activated by hyperglycemia and result in the accumulation of cell matrix proteins in diabetic patients.
Figure 7.
Proposed model of cell matrix proteins accumulation in diabetes. Regulation of tuberin by HG activates downstream translation signals that enhance matrix proteins accumulation in the diabetic kidney. Certain transcription factors (TFs) may regulate the cell matrix proteins through unknown transcriptional mechanism.
Concise Methods
Animals
All animal studies were conducted with the approval of the Institutional Animal Care and Use Committee of the University of Texas Health Science Center at San Antonio. Two-month-old male wild-type (TSC2+/+) and TSC2+/− rats weighing between 200 and 225 g were purchased from a breeding colony maintained at the University of Texas M.D. Anderson Cancer Center (Smithville, TX). Animals were allowed food and water ad libitum throughout the experiments. The rats were divided into three groups of four rats per group. Under isoflurane inhalation anesthesia, rats were injected in the tail vein with either the vehicle sodium citrate buffer (group 1 controls), 55 mg/kg body weight of streptozotocin (Sigma, St. Louis, MO) in sodium citrate buffer (0.01 M, pH 4.5) (group 2), or 55 mg/kg body weight of streptozotocin and treated with 6 U daily of insulin to normalize the glucose level (group 3). Average serum glucose levels, kidney and body weight of the groups were measured at 4 weeks of diabetes. Animals were euthanized at 4 weeks and the kidneys were removed rapidly. Half of the kidney from each animal was immediately snap-frozen in liquid nitrogen. Cortical tissues were used for biochemical analysis. Creatinine was measured in urine and plasma samples using an Olympus auto analyzer (AU640; Olympus Corp, Melville, NY) as previously described.25 Creatinine clearance was calculated according to standard formulas. Albumin was measured in the 24-hour urine collection of each animal by an ELISA ALPCO kit (Salem, NH).
Cell Culture
PPTECs were isolated from wild-type and TSC2+/− rats and cultured as described previously.22 Cells were seeded on 60-mm Petri dishes in 5 mmol/L glucose (NG). At 90% confluency, cells were incubated in serum-free medium for 18 hours before treatment with HG (25 mmol/L glucose), and/or Akt inhibitor or mTOR inhibitor under serum-free conditions.
Overexpression of Tuberin
Mouse embryonic fibroblasts TSC2−/− and TSC2+/+ cells were grown to 70%–80% confluency. TSC2−/− were infected with Ad-TSC2 at 20 MOI as described previously.26 Viral stocks were prepared and titered using the serial dilution technique as described in the Adeno-X Expression Systems User Manual (Clontech Laboratories, Mountain View, CA).27 Adenovirus for green fluorescent protein was used as a control. The cells were harvested at 48 hours of transfection for immunoblotting.
Western Blot Analyses
Homogenates of kidney cortex or cell lysates were prepared as described previously.28 Protein concentrations were determined with the Bradford assay using BSA as a standard.29 Western blot analysis was performed as described previously.11 Phospho-tuberin, tuberin, phospho-Akt, Akt, phospho-p70S6K, and p70S6K antibodies were from Cell Signaling (Beverly, MA); actin and glyceraldehyde 3-phosphate dehydrogenase antibodies were obtained from Santa Cruz Biotechnology. Fibronectin rabbit antibody was from Sigma. An enhanced chemiluminescence kit (Amersham, Piscataway, NJ) was used to identify protein expression. Expression of each protein was quantified by densitometry using National Institutes of Health Image 1.62 software and normalized to a loading control.
Immunofluorescence Staining for Phospho-Tuberin and Phospho-p70S6K
Phospho-p70S6K and phospho-tuberin expression was assessed by immunofluorescence as previously described.30 Frozen kidney sections (4 µm) were incubated with nonimmune donkey IgG to block nonspecific binding, and then incubated with rabbit anti-phospho-S6K antibody followed by FITC-labeled anti-rabbit IgG or with phospho-tuberin antibody followed by Alexa Fluor-labeled donkey anti-rabbit IgG (Chemicon, Temecula, CA). Controls consisted of PBS/BSA in place of primary antibody followed by detection procedures as outlined above. Kidney sections were viewed and photographed using an Olympus Research microscope equipped for epifluorescence with excitation and band pass filters. FITC green signals for phospho-p70S6K and Alexa Fluor red signals for phospho-tuberin were detected using a filter with excitation at 535 nm and 594 nm, respectively.
Immunoperoxidase Staining of Fibronectin and Collagen IV
Detection of fibronectin was performed on sections of frozen kidney tissue from control, diabetic and diabetic plus insulin groups by immunoperoxidase histochemical staining.31 Kidney sections underwent a protease digestion step before they were incubated with rabbit anti-fibronectin antibody (Sigma, St. Louis, MO) or anti-collagen IV antibody (Abcam, Cambridge, MA) for 30 minutes and then washed twice with PBS. Sections were then incubated with horseradish peroxidase–labeled anti-rabbit antibody for 30 minutes. The horseradish peroxidase was developed with diaminobenzidine tetrahydrochloride and hydrogen peroxide in PBS. Control sections in both procedures were incubated without primary antibody.
Quantitation of mRNA by RT-PCR
RNA was isolated from cells treated with HG (25 mM) or cells pretreated with actinomycin D (50 μM) before exposed to HG for 24 hours using RNA Isolation Solvent (Tel-Test). RT-PCR was performed as previously described using the primers (5′-GGAGAGCAAGCCTGAACCTGAAGAACC/5′-CCTGGTGTCCTGATCATTGCATC) for fibronectin. The amplified product was 356-bp long. For β-actin, an internal control of amplification, upstream/reverse primers were 5′-GATGACCCAGATCATGTTTGAGA/5′-CTGTAGGCATTTCTGGAGATA synthesizing a 528-bp product. The PCR products were analyzed by electrophoresis on agarose gels and ethidium bromide staining. The yield was determined by densitometry and the ratio of fibronectin to actin was then calculated.
Transcriptional Activity of Fibronectin Promoter
A mouse fibronectin promoter reporter plasmid was used to determine the transcriptional activity of the fibronectin gene.32 A Renilla reporter plasmid (pRL-null) was used as transfection control. Plasmids were transfected into PPTECs using the Lipofectamine and Plus Reagent method (Life Technologies, NY). Lipofectamine was added to the complex of DNA and Plus reagent and incubated for 15 minutes at room temperature. DNA and Plus reagent-Lipofectamine complexes were added to each well and incubated at 37°C with 5% CO2. After incubation for 3–4 hours, 1 ml of fresh media with 20% serum was added to a final concentration of 10%. Cells were pretreated with rapamycin (20 nM) before exposure to HG for 24 hours. Forty-eight hours after transfection, cells were harvested for Firefly and Renilla luciferase assay using the Dual-Luciferase Reporter assay kit (Promega, Madison, WI). Luciferase activity was determined using the Luciferase Reporter Assay System and a Turner luminometer according to the manufacturer's instructions (Promega) and normalized to Renilla activity.
Statistical Analyses
Data are presented as mean ± SEM. Statistical differences were determined using ANOVA followed by Dunnett’s (experimental versus control) test using one trial analysis. P values <0.05 and <0.01 were considered statistically significant.
Disclosures
None.
Supplementary Material
Acknowledgments
This work was supported in part by grants from the American Heart Association and a Merit Review Award from the South Texas Veterans Healthcare System (to S.L.H.).
Footnotes
Published online ahead of print. Publication date available at www.jasn.org.
This article contains supplemental material online at http://jasn.asnjournals.org/lookup/suppl/doi:10.1681/ASN.2012030285/-/DCSupplemental.
References
- 1.Brownlee M: The pathobiology of diabetic complications: A unifying mechanism. Diabetes 54: 1615–1625, 2005 [DOI] [PubMed] [Google Scholar]
- 2.Phillips AO, Steadman R: Diabetic nephropathy: The central role of renal proximal tubular cells in tubulointerstitial injury. Histol Histopathol 17: 247–252, 2002 [DOI] [PubMed] [Google Scholar]
- 3.Brownlee M: Biochemistry and molecular cell biology of diabetic complications. Nature 414: 813–820, 2001 [DOI] [PubMed] [Google Scholar]
- 4.Fioretto P, Bruseghin M, Berto I, Gallina P, Manzato E, Mussap M: Renal protection in diabetes: Role of glycemic control. J Am Soc Nephrol 17[Suppl 2]: S86–S89, 2006 [DOI] [PubMed] [Google Scholar]
- 5.Ziyadeh FN, Snipes ER, Watanabe M, Alvarez RJ, Goldfarb S, Haverty TP: High glucose induces cell hypertrophy and stimulates collagen gene transcription in proximal tubule. Am J Physiol 259: F704–F714, 1990 [DOI] [PubMed] [Google Scholar]
- 6.The Diabetes Control and Complications Trial Research Group : The effect of intensive treatment of diabetes on the development and progression of long-term complications in insulin-dependent diabetes mellitus. N Engl J Med 329: 977–986, 1993 [DOI] [PubMed] [Google Scholar]
- 7.Morrisey K, Steadman R, Williams JD, Phillips AO: Renal proximal tubular cell fibronectin accumulation in response to glucose is polyol pathway dependent. Kidney Int 55: 160–167, 1999 [DOI] [PubMed] [Google Scholar]
- 8.Manning BD, Tee AR, Logsdon MN, Blenis J, Cantley LC: Identification of the tuberous sclerosis complex-2 tumor suppressor gene product tuberin as a target of the phosphoinositide 3-kinase/akt pathway. Mol Cell 10: 151–162, 2002 [DOI] [PubMed] [Google Scholar]
- 9.Inoki K, Li Y, Zhu T, Wu J, Guan KL: TSC2 is phosphorylated and inhibited by Akt and suppresses mTOR signalling. Nat Cell Biol 4: 648–657, 2002 [DOI] [PubMed] [Google Scholar]
- 10.Dan HC, Sun M, Yang L, Feldman RI, Sui XM, Ou CC, Nellist M, Yeung RS, Halley DJ, Nicosia SV, Pledger WJ, Cheng JQ: Phosphatidylinositol 3-kinase/Akt pathway regulates tuberous sclerosis tumor suppressor complex by phosphorylation of tuberin. J Biol Chem 277: 35364–35370, 2002 [DOI] [PubMed] [Google Scholar]
- 11.Simone S, Gorin Y, Velagapudi C, Abboud HE, Habib SL: Mechanism of oxidative DNA damage in diabetes: Tuberin inactivation and downregulation of DNA repair enzyme 8-oxo-7,8-dihydro-2′-deoxyguanosine-DNA glycosylase. Diabetes 57: 2626–2636, 2008 [DOI] [PMC free article] [PubMed] [Google Scholar]
- 12.Inoki K, Zhu T, Guan KL: TSC2 mediates cellular energy response to control cell growth and survival. Cell 115: 577–590, 2003 [DOI] [PubMed] [Google Scholar]
- 13.Sekulić A, Hudson CC, Homme JL, Yin P, Otterness DM, Karnitz LM, Abraham RT: A direct linkage between the phosphoinositide 3-kinase-AKT signaling pathway and the mammalian target of rapamycin in mitogen-stimulated and transformed cells. Cancer Res 60: 3504–3513, 2000 [PubMed] [Google Scholar]
- 14.Watson KL, Chou MM, Blenis J, Gelbart WM, Erikson RL: A Drosophila gene structurally and functionally homologous to the mammalian 70-kDa s6 kinase gene. Proc Natl Acad Sci U S A 93: 13694–13698, 1996 [DOI] [PMC free article] [PubMed] [Google Scholar]
- 15.Tee AR, Fingar DC, Manning BD, Kwiatkowski DJ, Cantley LC, Blenis J: Tuberous sclerosis complex-1 and -2 gene products function together to inhibit mammalian target of rapamycin (mTOR)-mediated downstream signaling. Proc Natl Acad Sci U S A 99: 13571–13576, 2002 [DOI] [PMC free article] [PubMed] [Google Scholar]
- 16.Kenerson HL, Aicher LD, True LD, Yeung RS: Activated mammalian target of rapamycin pathway in the pathogenesis of tuberous sclerosis complex renal tumors. Cancer Res 62: 5645–5650, 2002 [PubMed] [Google Scholar]
- 17.Mori H, Inoki K, Masutani K, Wakabayashi Y, Komai K, Nakagawa R, Guan KL, Yoshimura A: The mTOR pathway is highly activated in diabetic nephropathy and rapamycin has a strong therapeutic potential. Biochem Biophys Res Commun 384: 471–475, 2009 [DOI] [PubMed] [Google Scholar]
- 18.Potter CJ, Huang H, Xu T: Drosophila Tsc1 functions with Tsc2 to antagonize insulin signaling in regulating cell growth, cell proliferation, and organ size. Cell 105: 357–368, 2001 [DOI] [PubMed] [Google Scholar]
- 19.Samikkannu T, Thomas JJ, Bhat GJ, Wittman V, Thekkumkara TJ: Acute effect of high glucose on long-term cell growth: A role for transient glucose increase in proximal tubule cell injury. Am J Physiol Renal Physiol 291: F162–F175, 2006 [DOI] [PubMed] [Google Scholar]
- 20.Sautin YY, Lu M, Gaugler A, Zhang L, Gluck SL: Phosphatidylinositol 3-kinase-mediated effects of glucose on vacuolar H+-ATPase assembly, translocation, and acidification of intracellular compartments in renal epithelial cells. Mol Cell Biol 25: 575–589, 2005 [DOI] [PMC free article] [PubMed] [Google Scholar]
- 21.Uysal H, Hemming FW: Changes in the expression and distribution of fibronectin, laminin and tenascin by cultured fibroblasts from skin lesions of patients with tuberous sclerosis. Br J Dermatol 141: 658–666, 1999 [DOI] [PubMed] [Google Scholar]
- 22.Velagapudi C, Bhandari B, Werner SL, Simone S, Abboud HE, Habib SL: The tuberin/mTOR pathway promotes apoptosis of tubular epithelial cells in diabetes. J Am Soc Nephrol 22: 262–273, 2011 [DOI] [PMC free article] [PubMed] [Google Scholar]
- 23.White ES, Sagana RL, Booth AJ, Yan M, Cornett AM, Bloomheart CA, Tsui JL, Wilke CA, Moore BB, Ritzenthaler JD, Roman J, Muro AF: Control of fibroblast fibronectin expression and alternative splicing via the PI3K/Akt/mTOR pathway. Exp Cell Res 316: 2644–2653, 2010 [DOI] [PMC free article] [PubMed] [Google Scholar]
- 24.Ong CT, Khoo YT, Mukhopadhyay A, Do DV, Lim IJ, Aalami O, Phan TT: mTOR as a potential therapeutic target for treatment of keloids and excessive scars. Exp Dermatol 16: 394–404, 2007 [DOI] [PubMed] [Google Scholar]
- 25.Danda RS, Habiba NM, Rincon-Choles H, Bhandari BK, Barnes JL, Abboud HE, Pergola PE: Kidney involvement in a nongenetic rat model of type 2 diabetes. Kidney Int 68: 2562–2571, 2005 [DOI] [PubMed] [Google Scholar]
- 26.Habib SL, Riley DJ, Mahimainathan L, Bhandari B, Choudhury GG, Abboud HE: Tuberin regulates the DNA repair enzyme OGG1. Am J Physiol Renal Physiol 294: F281–F290, 2008 [DOI] [PubMed] [Google Scholar]
- 27.Clontech Laboratories: Adeno-X Expression Systems User Manual Clontech Laboratories, Mountain View, CA, 2012 [Google Scholar]
- 28.Habib SL, Bhandari BK, Sadek N, Abboud-Werner SL, Abboud HE: Novel mechanism of regulation of the DNA repair enzyme OGG1 in tuberin-deficient cells. Carcinogenesis 31: 2022–2030, 2010 [DOI] [PMC free article] [PubMed] [Google Scholar]
- 29.Bradford MM: A rapid and sensitive method for the quantitation of microgram quantities of protein utilizing the principle of protein-dye binding. Anal Biochem 72: 248–254, 1976 [DOI] [PubMed] [Google Scholar]
- 30.Habib SL, Simone S, Barnes JJ, Abboud HE: Tuberin haploinsufficiency is associated with the loss of OGG1 in rat kidney tumors. Mol Cancer 7: 10–14, 2008 [DOI] [PMC free article] [PubMed] [Google Scholar]
- 31.Ye P, Habib SL, Ricono JM, Kim NH, Choudhury GG, Barnes JL, Abboud HE, Arar MY: Fibronectin induces ureteric bud cells branching and cellular cord and tubule formation. Kidney Int 66: 1356–1364, 2004 [DOI] [PubMed] [Google Scholar]
- 32.Dean DC, Bowlus CL, Bourgeois S: Cloning and analysis of the promotor region of the human fibronectin gene. Proc Natl Acad Sci U S A 84: 1876–1880, 1987 [DOI] [PMC free article] [PubMed] [Google Scholar]
Associated Data
This section collects any data citations, data availability statements, or supplementary materials included in this article.


