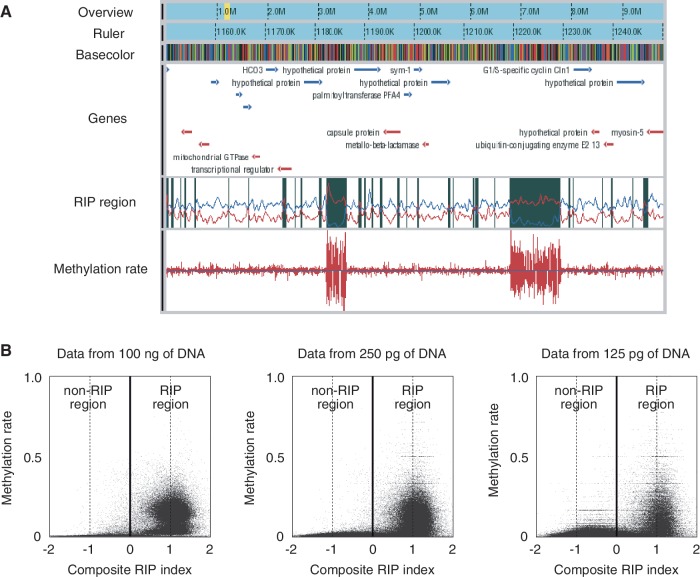
Figure 2.
WGBS of N. crassa by PBAT. (A) A snapshot of WGBS data obtained from 100 ng of DNA. The browser contains six tracks for overview, ruler, basecolor (nucleotide sequence), gene, RIP region and methylation rates from the top to the bottom. The yellow band in the overview track indicates the position of the region displayed in the other five tracks. Genes on the top and bottom strands are colored in blue and red, respectively. A RIP region colored in black in the RIP region track was defined as a region with a positive value of the composite RIP index obtained by subtracting the RIP substrate index (CpA + TpG/ApC + GpT, blue line plot in the track) from the RIP product index (TpA/ApT, red line plot in the track) (19). Methylation rates are indicated for both top and bottom DNA strands. Note that two large RIP regions are heavily methylated. (B) Cooccurrence of methylation and RIP. The moving averages (window size, 500 bp; step size, 100 bp) of methylation rate were plotted against those of the composite RIP index. WGBS data obtained from 100 ng and 250 and 125 pg of DNA were used for the analysis (Supplementary Table S1).

