Figure 7.
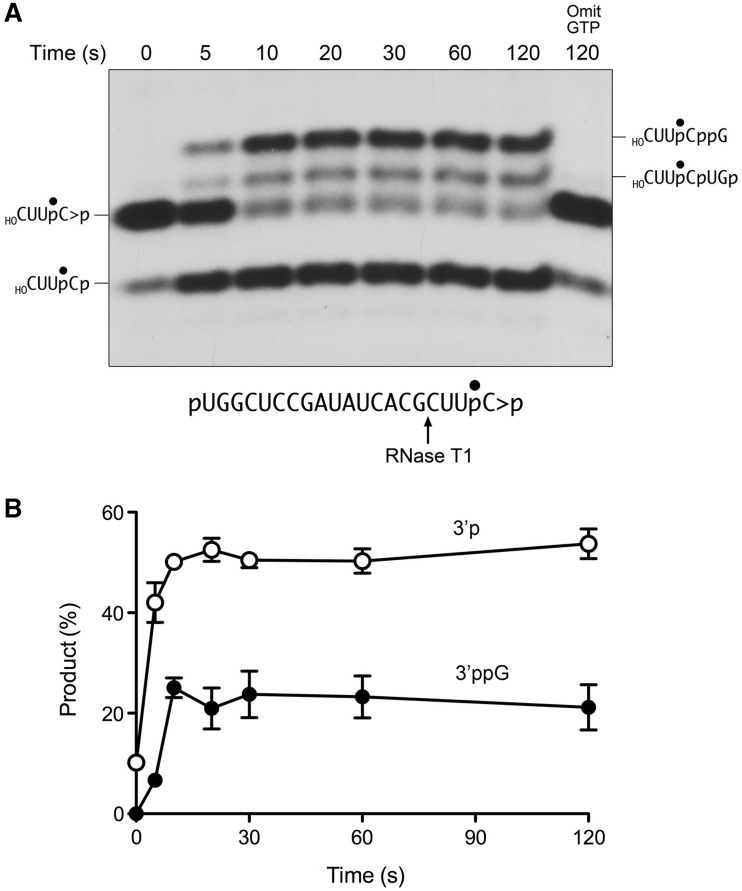
Kinetics of the hydrolysis of RNA 2′,3′-cyclic phosphate and subsequent 3′-phosphate guanylylation. (A) RtcB was reacted with pRNA > p in the presence of 0.1 mM GTP as described in Figure 5. The reactions were quenched with EDTA at the times specified. (A control mixture containing RtcB and pRNAp but no added GTP was incubated for 120 s). The RNAs were digested with RNase T1 and the products were analyzed by Urea–PAGE and visualized by autoradiography. (B) The levels of the 3′-phosphate T1 fragment (open circle) and the 3′-ppG T1 fragment (closed circle), expressed as the percentage of the total radiolabeled material, are plotted as a function of reaction time. Each datum is the average of three independent experiments ± SEM.

