Figure 5.
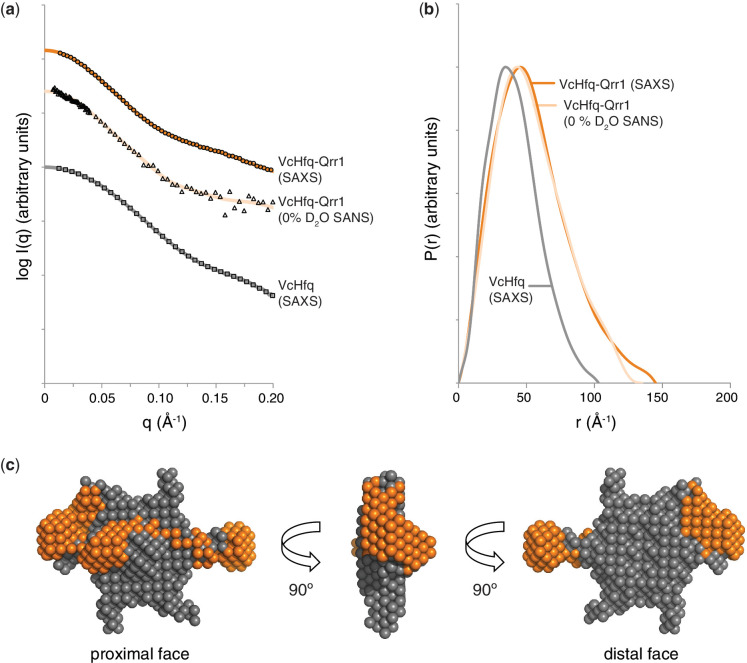
Low-resolution model of the VcHfq-Qrr1 complex. (a) SAXS scattering curve for free VcHfq (squares), SAXS scattering curve for the VcHfq-Qrr1 complex (circles) and SANS scattering curve for the VcHfq-Qrr1 complex in 0% D2O (triangles). Back-transformed distance distribution functions, P(r), are shown as a solid grey line, a solid dark orange line and a solid light orange line for the SAXS data of free VcHfq, the SAXS data of the VcHfq-Qrr1 complex and the SANS data of the VcHfq-Qrr1 complex, respectively. (b) P(r) functions for the SAXS data of free VcHfq (grey), the SAXS data of the VcHfq-Qrr1 complex (dark orange) and the SANS data of the VcHfq-Qrr1 complex (light orange). (c) Ab initio model of the VcHfq-Qrr1 complex generated in MONSA (29,30) and visualized in PyMOL. VcHfq is shown as grey spheres and the Qrr1 sRNA as dark orange spheres.

