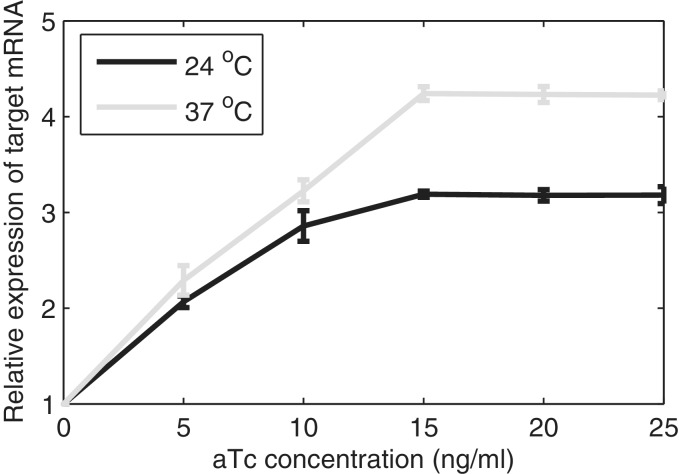
Figure 3.
Relative expression level of target mRNA induced with different concentrations of aTc (ng/ml) at 24°C and 37°C, quantified by qPCR using the 16 S rRNA gene as reference. The standard deviation bars are from three independent experiments. In some cases, these bars’ lengths are too small to be visible.

