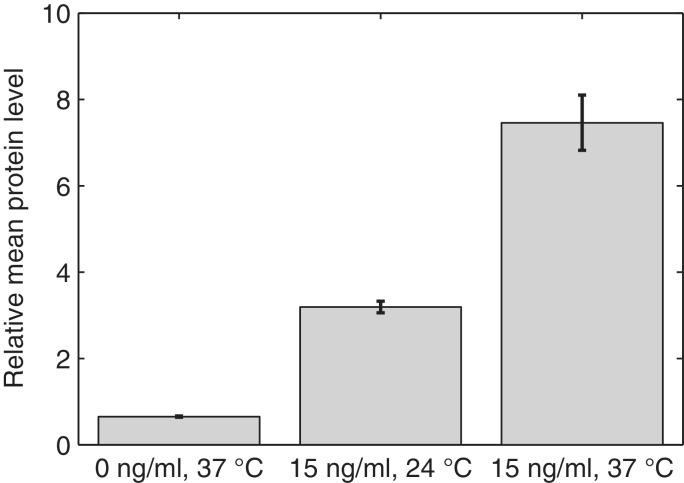
Figure 4.
Relative mean expression level of target proteins (mRFP1) estimated by microplate fluorometer in three conditions. The error bars are the standard deviation from the measurements in the different wells. For precise quantities, see Supplementary Table S1.

