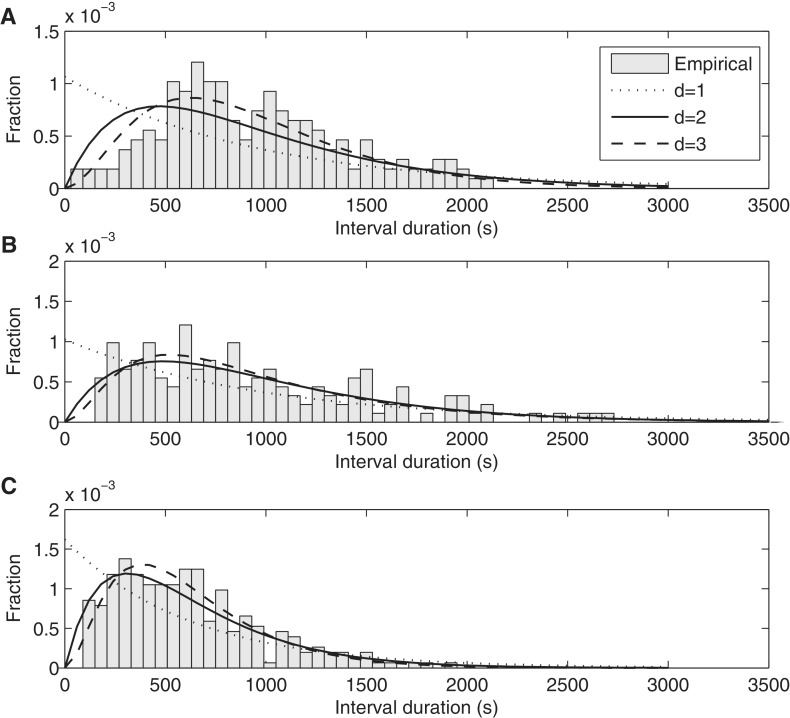
Figure 7.
Distributions of time intervals between productions of consecutive mRNA molecules in individual cells under the control of PtetA in conditions: (A) 0 ng/ml aTc at 37°C, obtained from 157 cells and 43 intervals (B) 15 ng/ml aTc at 24°C, obtained from 119 cells and 100 intervals, and (C) 15 ng/ml aTc at 37°C, obtained from 113 cells and 254 intervals. The probability density functions of inferred models of transcription initiation with differing number of rate-limiting steps are also shown in each plot. Note the different scales in the y-axis.

