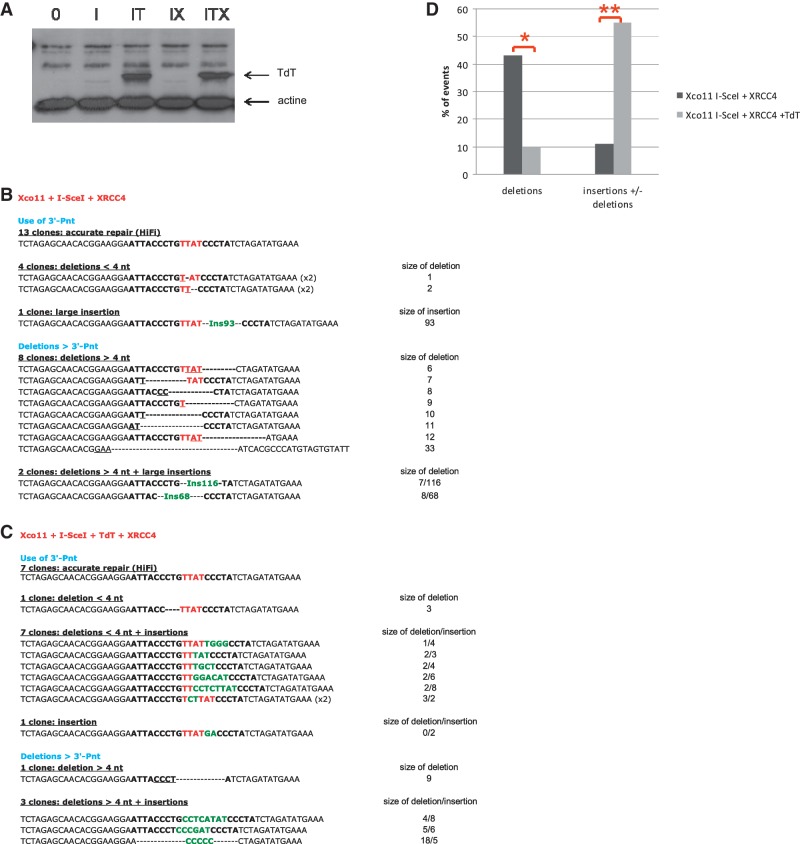
Figure 5.
Sequence analysis of the junctions in XRCC4-complemented cells. (A) Western blot showing the level of TdT expression in XRCC4-deficient cells and complemented cells. I: I-SceI; IT: I-SceI + TdT; IX: I-SceI + XRCC4; ITX: I-SceI + XRCC4 + TdT. (B) Junction sequences from cells transfected with only the I-SceI expression vector. (C) Junction sequences from cells transfected with both the I-SceI and the TdT expression vectors. The nucleotides of the I-SceI sites are in bold, and the 4 nt that constitute the 3′ overhangs (the four 3′P-nt after the breaks) are indicated in red. The nucleotides involved in microhomology annealing are underlined. Extra-nucleotides added at the junction are in green. Parentheses indicate the number of identical sequences. (D) Frequencies of junctions with deletions and/or N-additions. P-values for N-additions in presence versus absence of TdT are indicated in the text and Table 1. *P < 0.05. **P < 0.01.

