Figure 2.
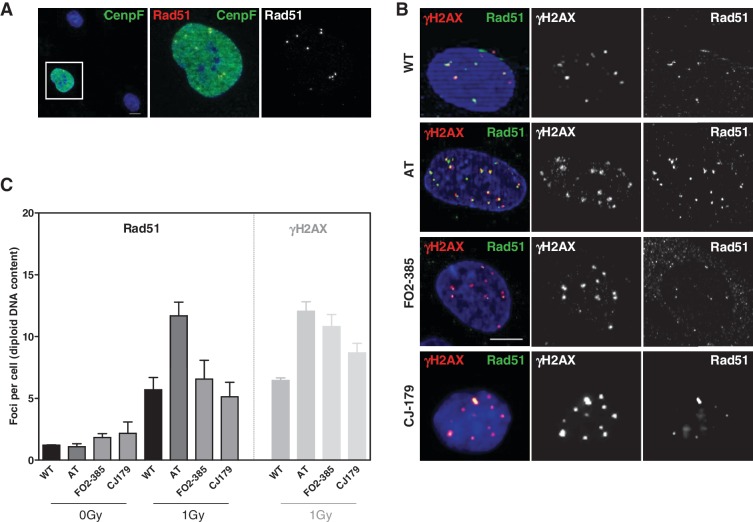
The number of Rad51 foci in G2 is elevated in AT but not in Artemis cells. (A) Differential staining for G2-phase cells (Cenp-F-positive) in addition to detection of Rad51. Rad51 foci were visible only in Cenp-F-positive G2-phase cells (left panel). Magnification revealed distinct Rad51 foci (yellow as merged from green and red). The right panel depicts the red channel only as recorded in black/white. (B) Cells were co-stained for γH2AX and Rad51, which showed that in AT cells all Rad51 foci co-localized with γH2AX but not in both Artemis cell lines. Shown are cells in G2. G1 cells did not stain for Rad51 and S-phase cells with hyperintense γH2AX signals were not considered. Bars, 10 µm. (C) Quantification of Rad51 and γH2AX foci 24 h after IR revealed identical numbers for both damage markers in WT and AT but not in both Artemis cell lines.

