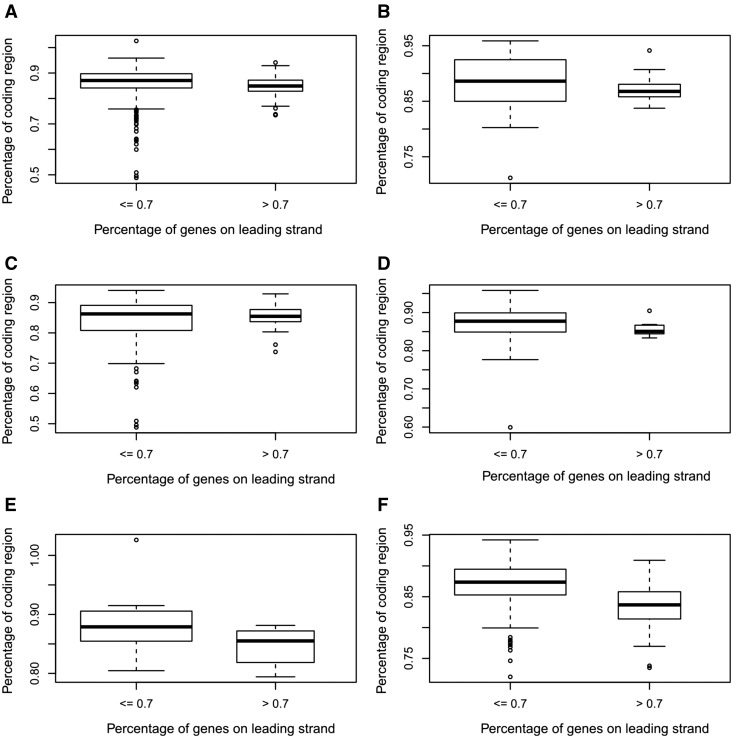
Figure 2.
Boxplots of the percentage of coding region versus the percentage of leading strand genes in a genome. (A) For all bacteria (P value of the Wilcoxon test: 1.1 × 10⁻⁸); (B) bacteria of specialized type with P value 0.22; (C) bacteria of host-associated type with P value 0.54; (D) bacteria of aquatic type with P value 0.065; (E) bacteria of terrestrial type with P value 0.0031 and (F) bacteria of multiple type with P value 1.9 × 10⁻⁹.

