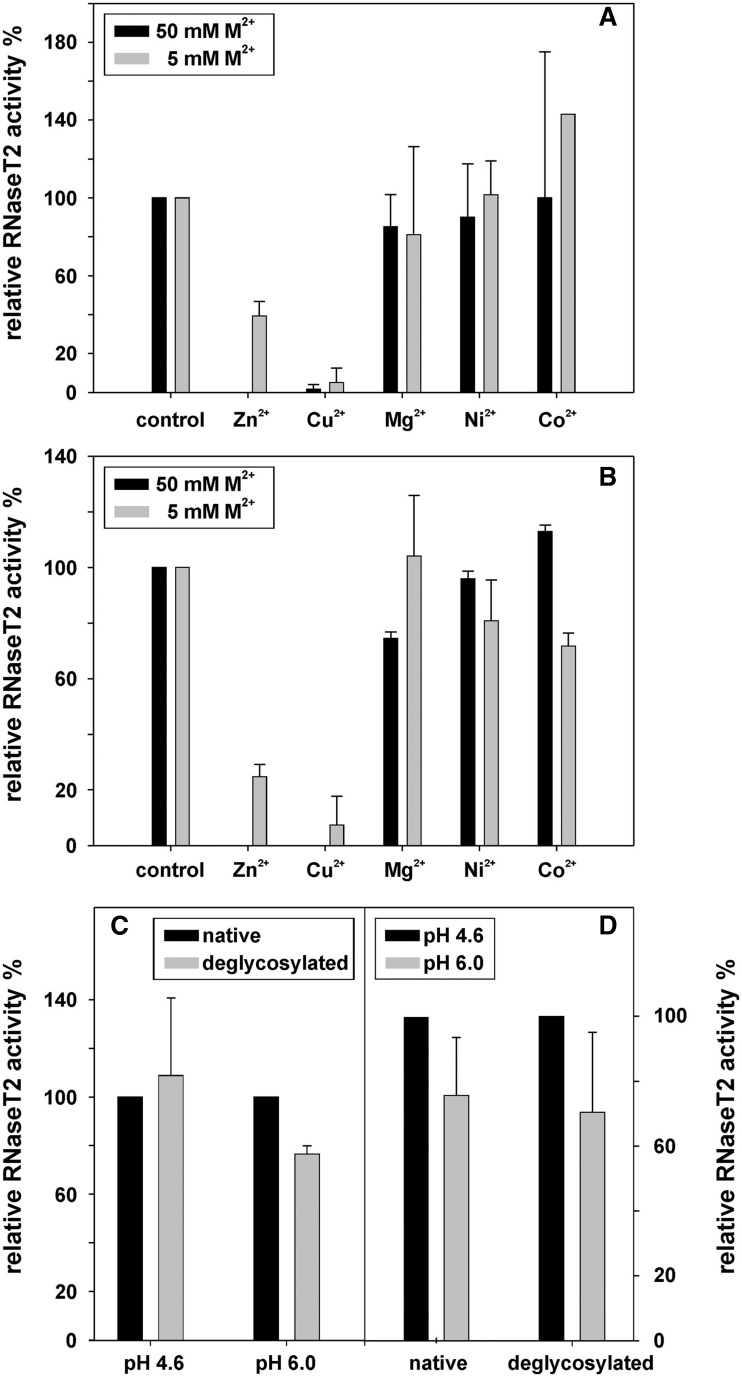
Figure 4.
The activity of RNase T2 was measured under different conditions. All values are means of two independent experiments and uncertainty ranges represent standard deviations. (A) At pH 6.0, the effects of several bivalent cations on RNase T2 activity were determined at 5 and 50 mM ion concentration. The activity bars are normalized relative to an untreated control. (B) The effects of several bivalent cations on RNase T2 activity were determined at 5 and 50 mM ion concentrations at pH 4.6. At this pH, RNase T2 showed an activity around 4.5 U/µg, with one unit defined as the amount of enzyme that produces a change of 1 OD260 in 30 min at 37°C. All activities are normalized relative to an untreated control. (C) The activity of native RNase T2 in comparison to that of deglycosylated RNase T2 at pH 4.6 and 6.0. The activity of the native protein was normalized as 100%. (D) The pH dependency of enzymatic activity was measured for native and for deglycosylated RNase T2, with the activity at pH 4.6 normalized to 100%.

