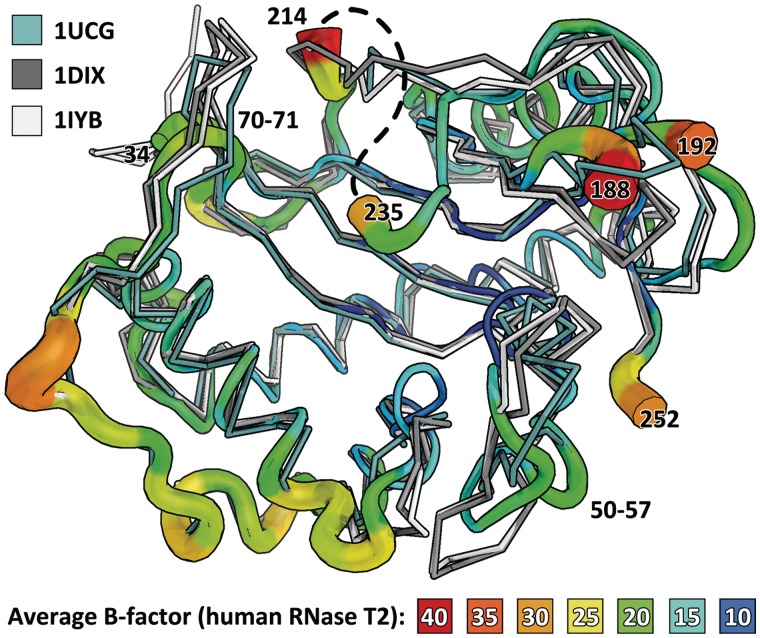
Figure 5.
Overlay of the B factor putty representation of human RNase T2 and three other members of its family: RNase MC1 (1UCG) in pale cyan, RNase Le (1DIX) in gray and RNase NW (1IYB) in light gray. The average displacement, given by the putty, is tightly related to the differences between the structures, suggesting that the rigid part mainly conveys the catalytic function while outer loops adapt. The structures from plant T2 RNases have a prolonged loop between residues 70 and 71. Also, the disordered loop 214–235 (approximate position is painted as a dashed line) seems not to have an equivalent in the other structures, and possibly involves an insertion. Loop 50-57 of RNase T2 bends inwards when compared with the other T2 RNases. Apart from these differences in the outer regions, the core fold is highly conserved and rigid, as can be seen from its low average B factor.

