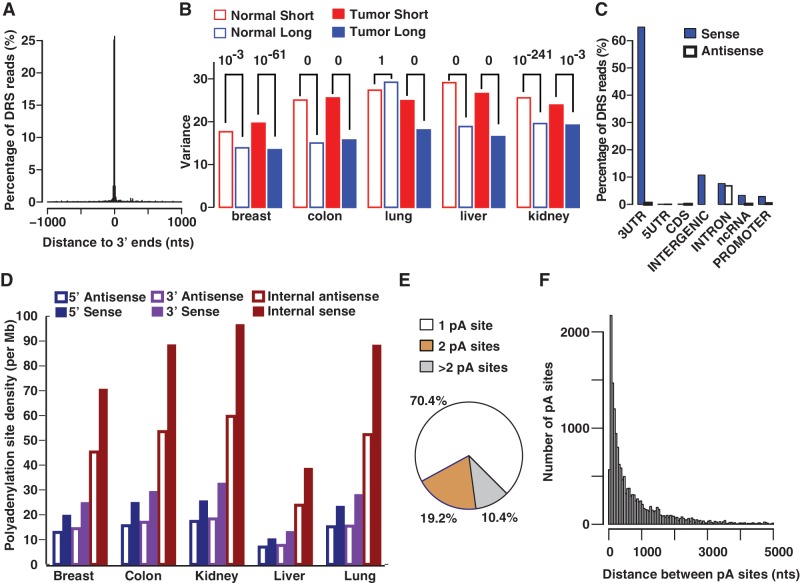
Figure 1.
Characteristics of polyadenylation sites. DRS reads from normal breast tissue are used for this illustration. (A) DRS reads predominantly map to annotated 3′ ends of known genes (bin size = 10 nts). (B) Cleavage sites of short isoforms in either normal (normal short) or tumor (tumor short), are generally (9/10) more variant than that of the corresponding long isoforms (P values on top). (C) In breast, the majority (∼90%) of DRS reads match to sense strands of transcriptionally active regions and the remaining reads mainly map to intergenic regions and introns. For illustration purposes, intergenic polyadenylation sites are assigned to the sense strand because categorizing (see ‘Materials and Methods’) them into sense and antisense strands separately can be ambiguous. (D) Polyadenylation density (number of sites/Mb) in internal introns is higher than that of terminal (5′ and 3′) introns for both sense and antisense intronic transcripts. (E) A considerable fraction (∼30%) of genes contains tandem polyadenylation (pA) sites within the same 3′ UTR. (F) Distribution of distances between adjacent tandem 3′ UTR pA sites of genes expressed in normal breast (bin size = 50 nts). Because of long 3′ UTRs, the separation between adjacent pA sites within the same UTR can be very large (>5 Kb) in some cases (1%).

