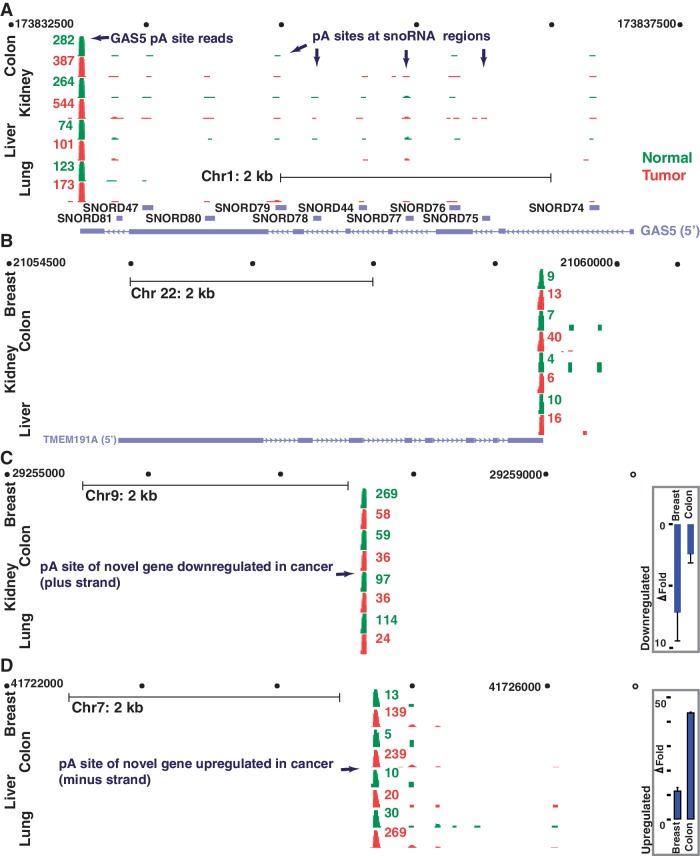
Figure 2.
Genomic view of polyadenylated non-coding RNAs and novel gene locations that are aberrantly expressed in cancer using xPAD. (A–D) All polyadenylation sites detected by DRS reads (green, normal; red, tumor) are indicated for all four gene regions. (A, B) GAS5 (A) and TMEM191A (B) represent lncRNAs that are upregulated in the majority of tumor samples, as indicated. In contrast to the polycistronic GAS5 which hosts multiple polyadenylated snoRNAs, polyadenylation of TMEM191A is limited to its 3′ UTR. (C and D) End locations and the expression levels of two potentially differentially regulated novel genes that are distantly located from known genes. Real-time PCR results also reveal similar expression patterns (fold change, P < 0.001); error bars represent standard deviation (n = 3).

