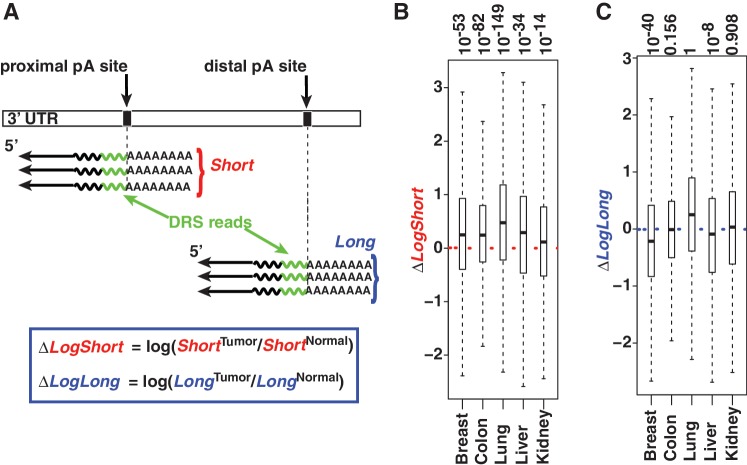
Figure 3.
Polyadenylation site usage reveal up-regulation of short isoforms in tumors. (A) Illustration on determining various 3′ UTR isoform-specific quantities (blue box) using DRS. Total number of normalized DRS reads for each isoform, abbreviated as Short (red) and Long (blue), are used to measure various changes between tumor and normal. (B and C) Median (thick line), 75% quantile (upper border), 25% quantile (lower border) and interquartile range (whiskers) are shown for each distribution (P values on top). (B) Short isoforms tend to be up-regulated in all tumor samples as indicated by the median (median >0, P values on top). (C) In contrast to short isoforms that have a consistent pattern, the median expression of long isoforms seems to flip between up/neutral/downregulation.

