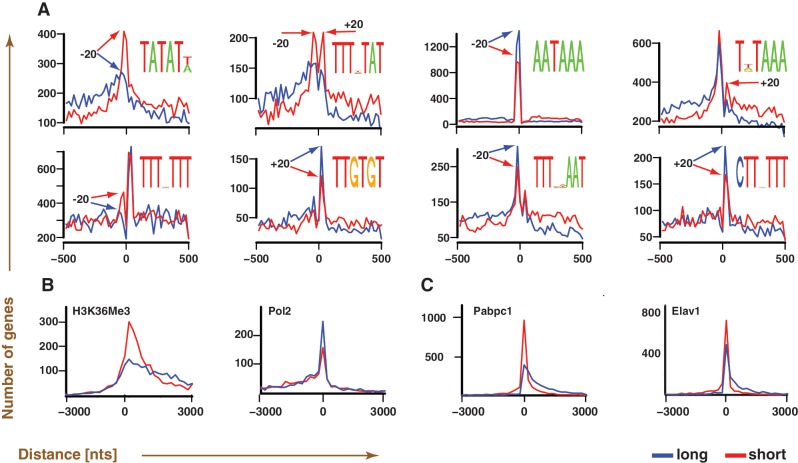
Figure 4.
Polyadenylation maps enable the identification of isoform-dependent regulatory marks. (A–C) A total of 3270 genes containing both long and short forms that are genomically separated by at least 100 nts at their 3′ ends are used for the analysis. (A) Motifs that are preferentially located near polyadenylation sites (position 0), and are more prevalently used by either short (red) or long (blue) isoform. Readily noticeable locational preferences of the consensus motif, visible as peaks (arrows), are generally within ±20 nts of the polyadenylation sites. (B and C) Chip-Seq/RIP-Seq data comparisons of H3K36Me3 and Pabpc1 to their functional analogs (Pol2 and Elav1) in identical cell lines (B: HepG2, C: GM12878) suggest preferential marking of polyadenylation sites of short isoforms by H3K36Me3 and Pabpc1. The curves correspond to the distance distribution between the location of a given polyadenylation site and the nearest regulatory mark (H3K36Me3, Pol2, Pabpc1 and Elav1), as inferred using Chip-Seq/RIP-Seq.

