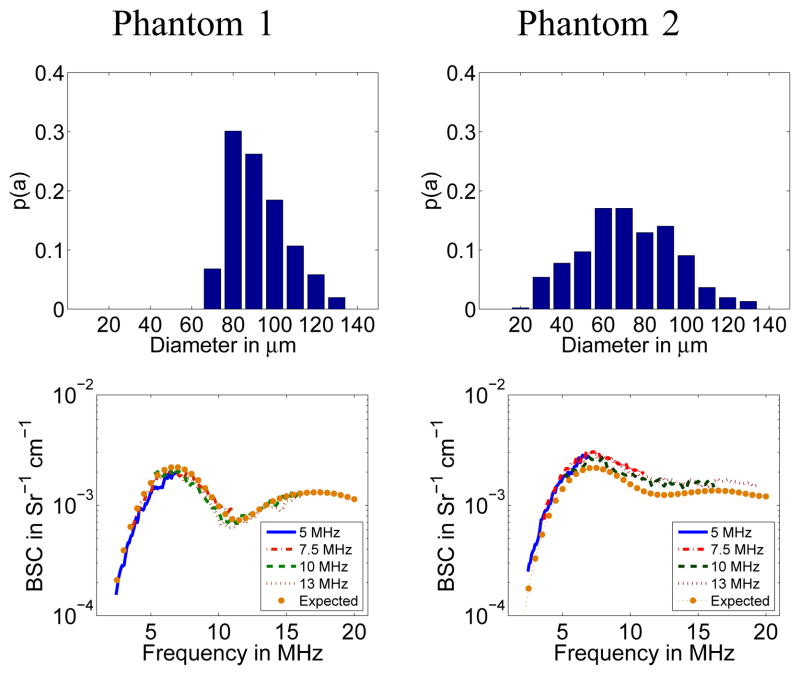
Fig. 2.
Scatterer size PDF p(a) (top row) and experimental BSC curves obtained with the 5, 7.5, 10, and 13 MHz transducers (bottom) corresponding to phantoms 1 (left) and 2 (right). In the bottom row plots, the BSCs predicted by theory are also presented for comparison (taken from [10]).

