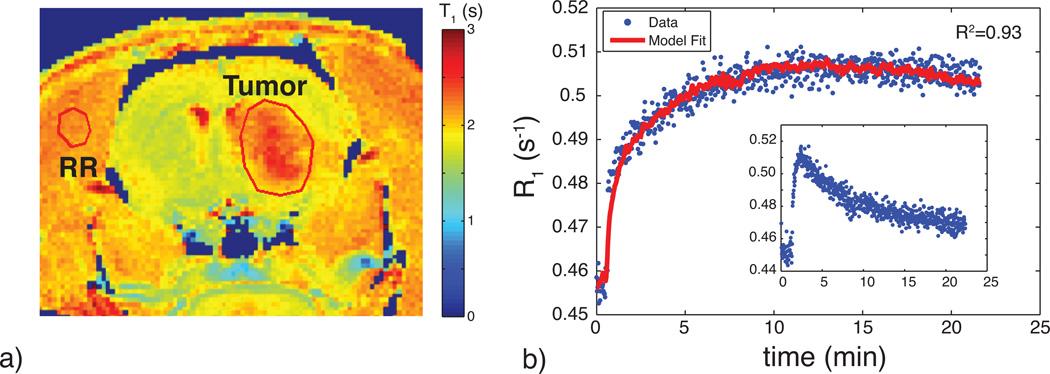
Fig. 3.
a) An example T10 map showing the location of the manually defined brain tumor ROI and reference tissue ROI in the temporal muscle. Note the elevated T1 times in the tumor region. b) Corresponding R1 time course including RR model fit. The RR model shows a good fit to the dynamic data. The inset displays the dynamic time course of the reference tissue used for RR modeling.

