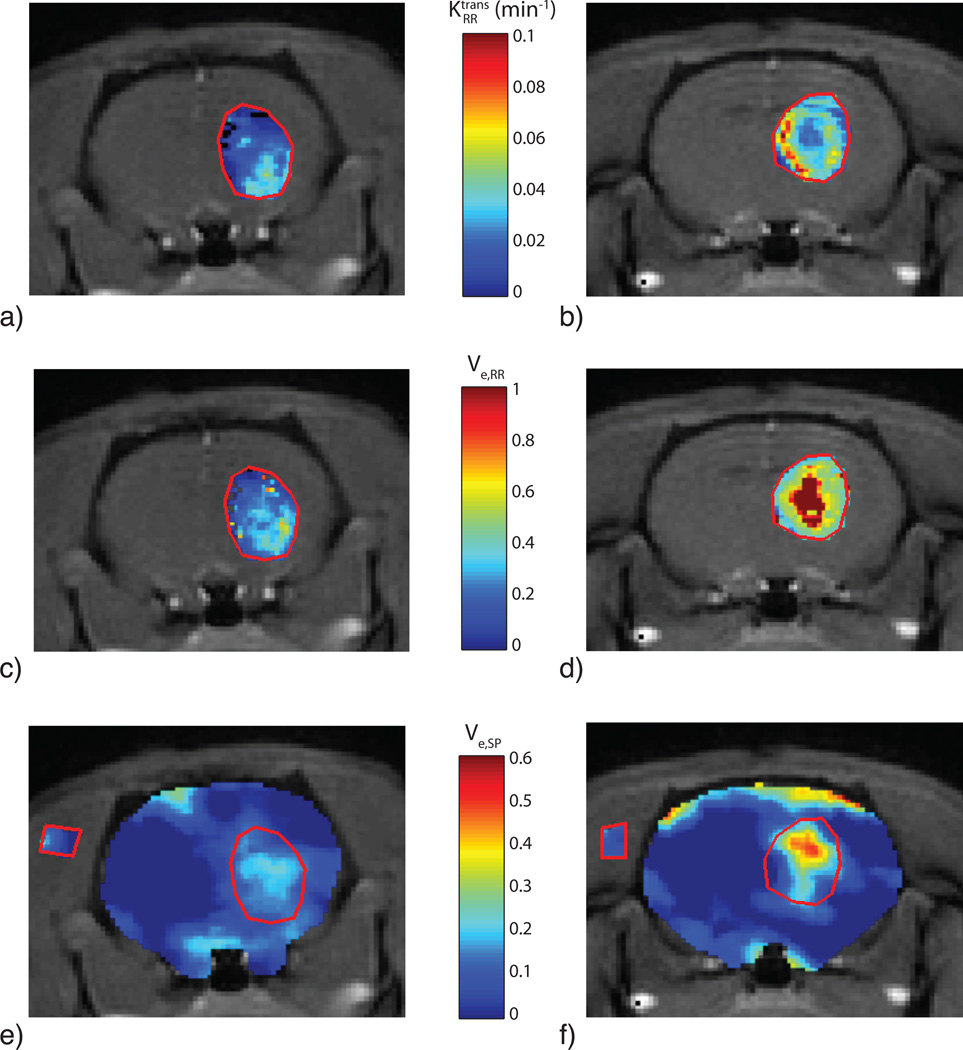
Fig. 4.
Parametric maps from RR model fitting and co-registered SPECT/MR images for two different rats (one per column). (a,b) maps, (c,d) ve,RR maps, and (e,f) ve,SP maps. Note the pseudocolor scale for ve is maximum at 1, apparent in the central region of the tumor in frame d). The SPECT maps in e) and f) display the tumor ROI as well as a ROI in the muscle. The apparent discrepancy between spatial location of of high ve,RR and high ve,SP might reflect limitation in the MRI-SPECT registration.

