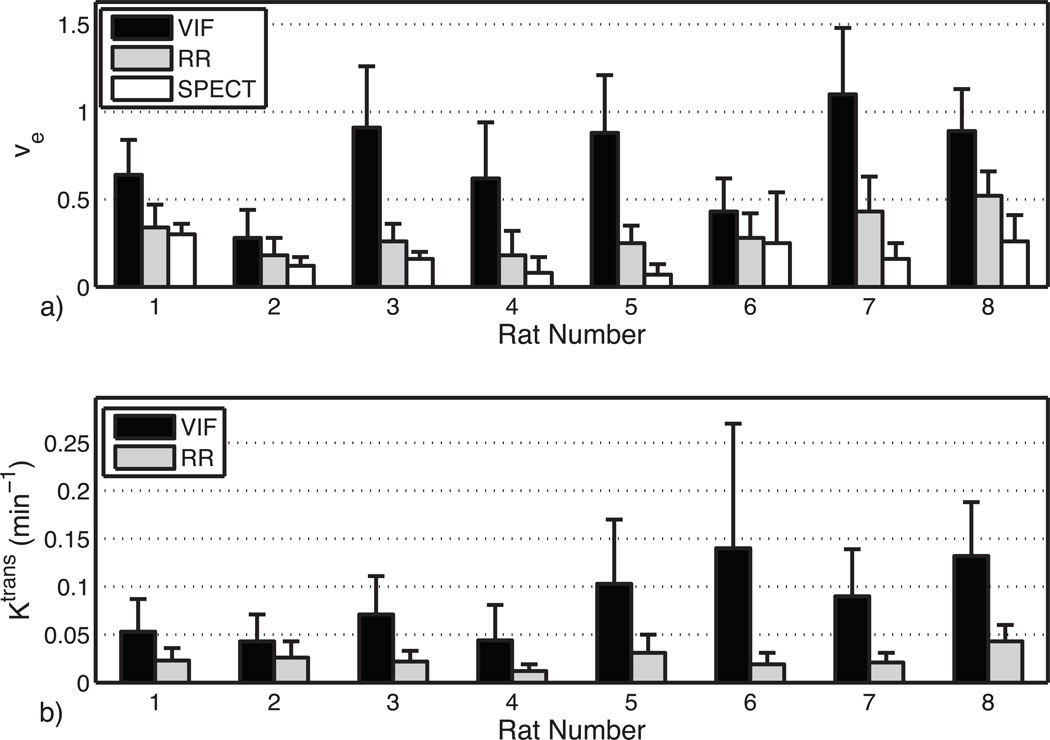
Fig. 5.
a) Comparison of ve for VIF, RR, and SPECT analysis for each animal studied. b) Comparison of Ktrans for VIF and RR analysis. Solid bars represent mean values while error bars represent the standard deviations. Note that error bars are somewhat underestimated because outlier voxels exhibiting ve > 2 or Ktrans > 0.5 min−1 were not included in analysis.

