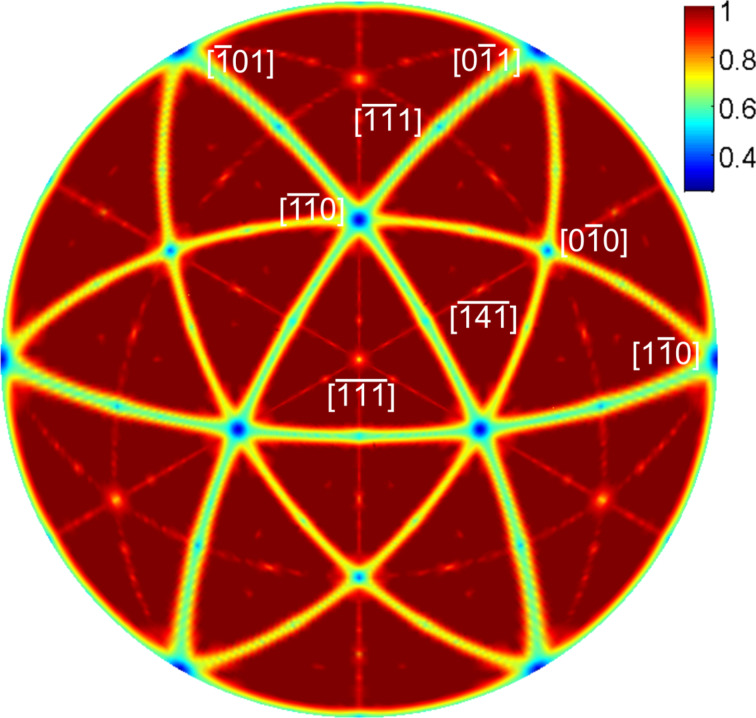
Figure 5.
Calculated map of channeling directions for an fcc crystal. The lines connecting the nodes at low-index directions in the polar plot represent channeling directions in the used thin slab of an fcc crystal. The color coding (opaque fraction) allows a qualitative interpretation of the width and depth of the scattering minima.

