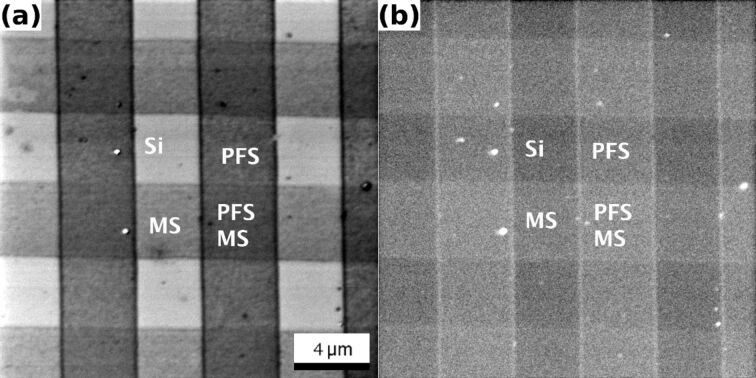
Figure 1.
HIM images with a FoV of 20 μm of thin organic layers on Si{001}. Data was recorded with a PE of 15 keV, and an ion dose of 2.46 × 1016 cm−2. (a) ET image of stripes of PFS (vertical) and MS (horizontal). The different areas and their termination are indicated. (b) BSHe image recorded simultaneously with (a). The different surface terminations can be distinguished.

