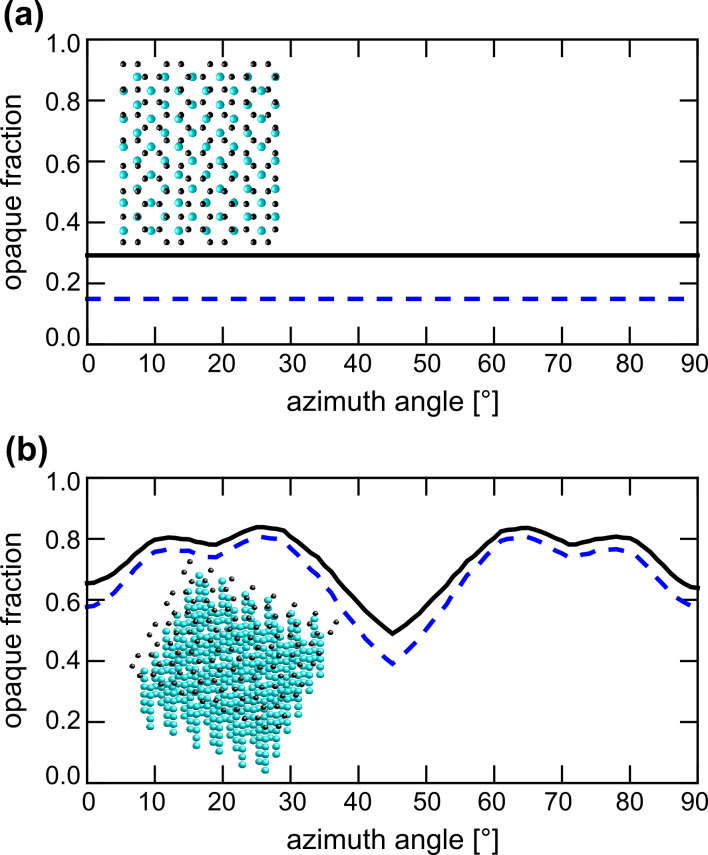
Figure 4.
Simulation of dechanneling contrast for clean and carbon-covered Si. The graphs show the opaque fraction of the projected crystal lattice. Blue dashed lines are obtained for a clean Si(001) crystal, whereas the black lines are obtained with a thin carbon layer added. (a) Normal incidence. The opaque projected area fraction is 15 and 29% for the clean and carbon-covered surface, respectively. There is no azimuthal dependence for this incident angle. (b) The same calculation but for a 10° sample tilt. The average opaque projected area fractions are 68 and 73% for the clean and carbon covered surface, respectively. A clear dependence on the azimuthal angle exists.

