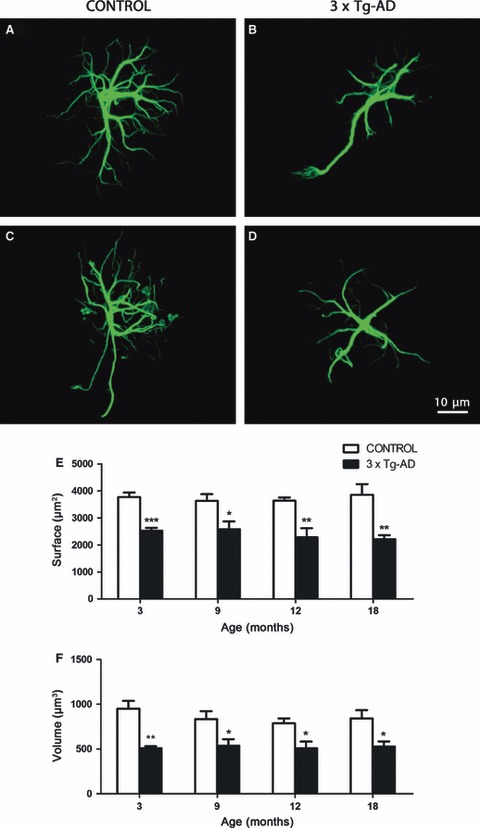
Fig. 1.

Confocal images showing the classical morphology of GFAP-positive astrocytes in control non-Tg animals and astrocytic atrophy in the 3 × Tg-AD animals at 3 months (A and B, respectively) and 18 months (C and D, respectively) in the mPFC. Bar graphs showing the decreases in the GFAP-positive surface area and volume throughout the whole extent of the mPFC (E, F) in 3 × Tg-AD mice when compared with control animals. Bars represent mean ± SEM.
