
Figure 4.
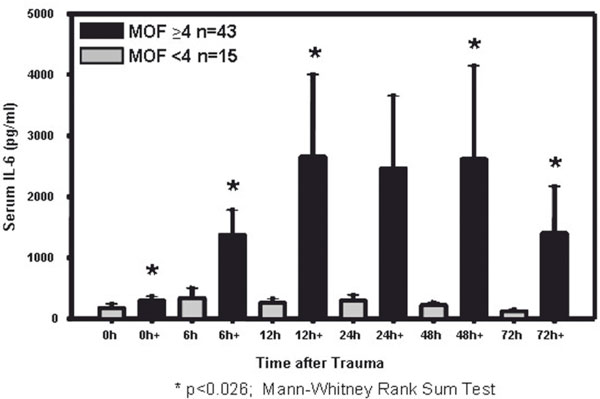
Il-6 release depending on MOF development: This figure shows IL-6 expression in patients who developed clinical signs of MOF (black columns, n = 43) as compared to those who did not (grey columns, n = 15). Significant serum level differences can be measured at all blood sampling time points except at 48 h).