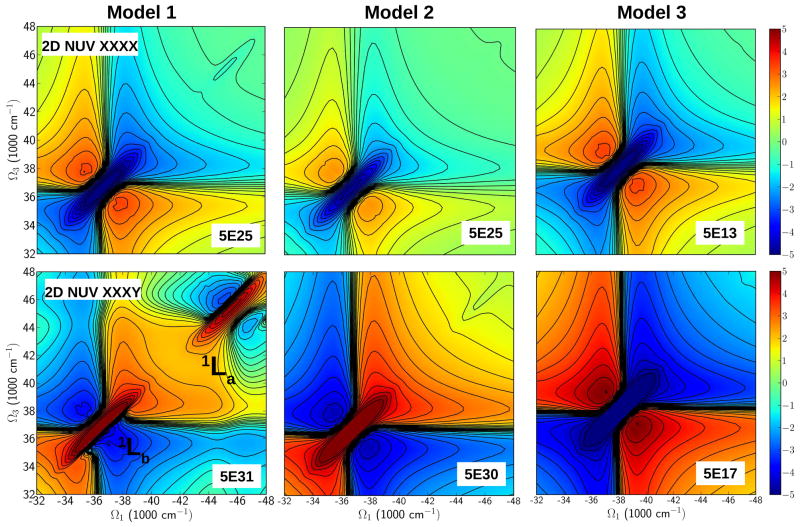
Figure 5.
Simulated 2DNUV photon echo signals of the three Aβ amyloid models. Top row: The non-chiral (xxxx) polarization configuration. The signals show a similar pattern but different intensities. Peaks centered at 37000 cm−1 is similar in intensity for Models 1 and 2 while in Model 3 is shifted away from the center and less intense. Bottom row: chirality induced (xxxy) polarization configuration. The spectra show some differences in the 1Lb region (37000 cm−1). Model 1 has a strong 1La transition at 46000 cm−1 while in Model 2 is weaker. Spectra are displayed on the non-linear scale as defined in ref. (34). The s parameter is shown at the bottom right of each panel.

