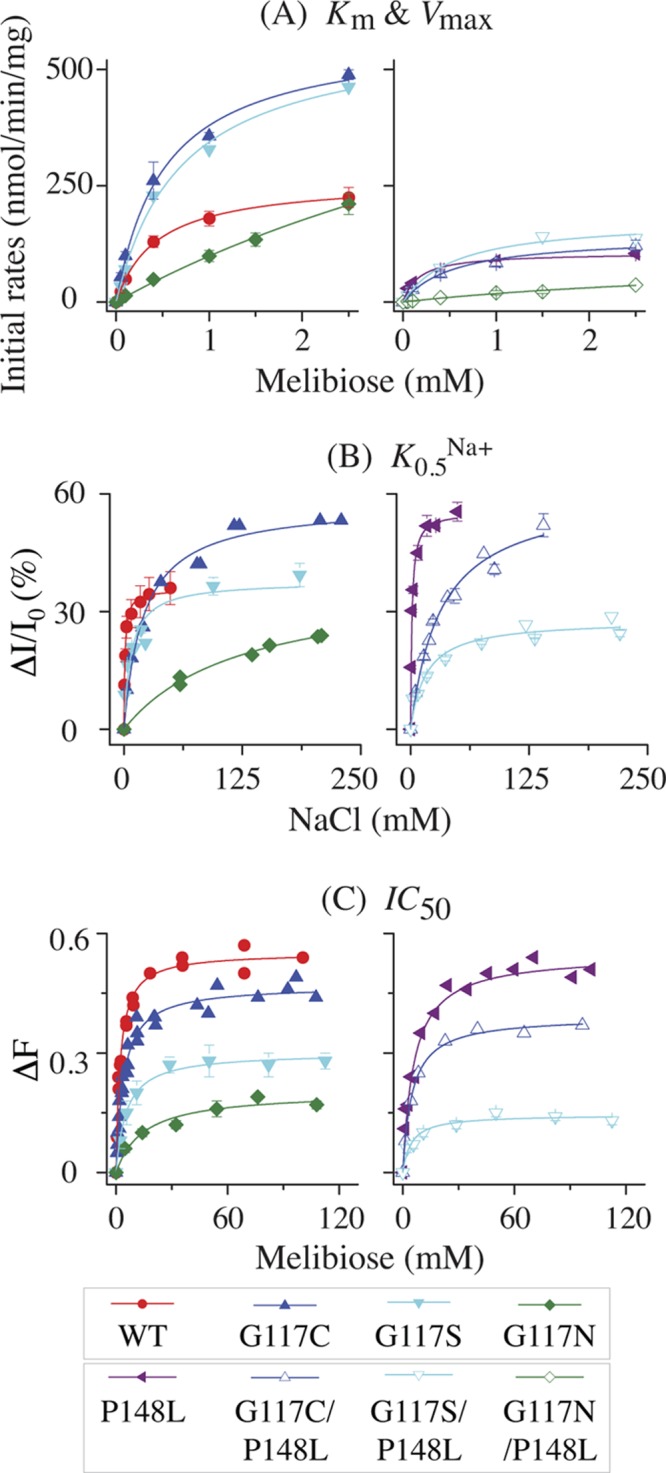
Fig 6.

Transport kinetics and cosubstrate-binding affinity. (A) Km and Vmax for melibiose transport. Cell preparation and transport assay were performed as described in Materials and Methods. Fitted initial rates of melibiose transport at a given melibiose concentration between 0.05 and 2.5 mM (specific activity, 3.2 to 10 mCi/mmol) were corrected by the rates obtained from nontransformed DW2 cells. Means (± standard errors [SE]) from 2 to 5 tests were plotted as a function of melibiose concentration. (B) Apparent affinity for Na+ binding. Determination of K0.5Na+ for the D2G FRET was carried out with RSO vesicles (0.5 mg/ml; 100 mM KPi, pH 7.5) containing the WT or a MelBSt mutant at excitation and emission wavelengths of 290 and 500 nm, respectively. The mean values of ΔI/I0 (%) with SE and/or the values from 2 to 3 tests were plotted as a function of Na+ concentration. (C) Apparent affinity for melibiose binding. Determination of IC50 for melibiose displacement of bound D2G was performed with RSO vesicles containing 10 μM D2G and 200 mM NaCl. The mean values of the melibiose-induced change in intensity (ΔF) with SE and/or data from 2 to 3 tests were plotted as a function of melibiose concentration. The values for Km, Vmax, K0.5Na+, and IC50 were determined by fitting a hyperbolic function to the data (OriginPro 8.6).
