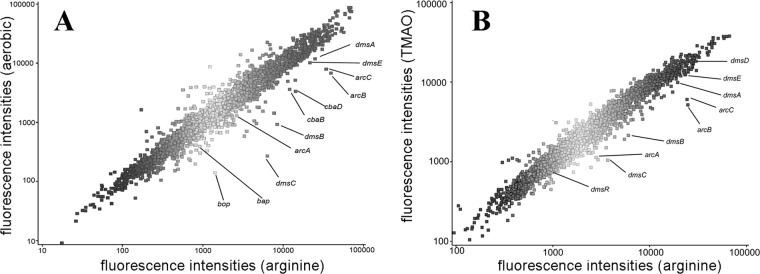
Fig 1.
Genome-wide transcriptomic data comparing Halobacterium sp. NRC-1 grown (A) aerobically (y axis) versus anaerobically with arginine (x axis) or (B) anaerobically with TMAO (y axis) versus arginine (x axis). DNA microarray data (fluorescence units) were generated using cDNA probes fluorescence labeled with Cy3 or Cy5 and analyzed employing Agilent's GeneSpring program (see Materials and Methods). Metabolic genes with high transcript levels during arginine fermentation are labeled with gene names (see the text).

