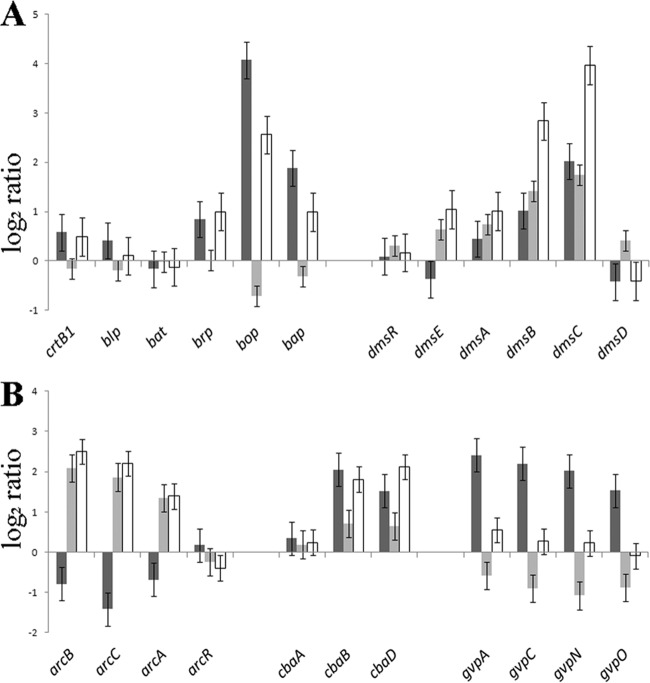
Fig 2.
Gene expression changes in Halobacterium sp. NRC-1 grown under different conditions. Log2 ratios (y axis) in gene expression are plotted for bop gene cluster and dms genes (A) and arc genes, cba genes, and gvp genes (B) (with the genes indicated below). Dark gray bars, anaerobic growth with TMAO versus aerobic growth; light gray bars, anaerobic growth with arginine versus anaerobic growth with TMAO; white bars, anaerobic growth with arginine versus aerobic growth. Error bars indicate standard errors.

