
Fig 4.
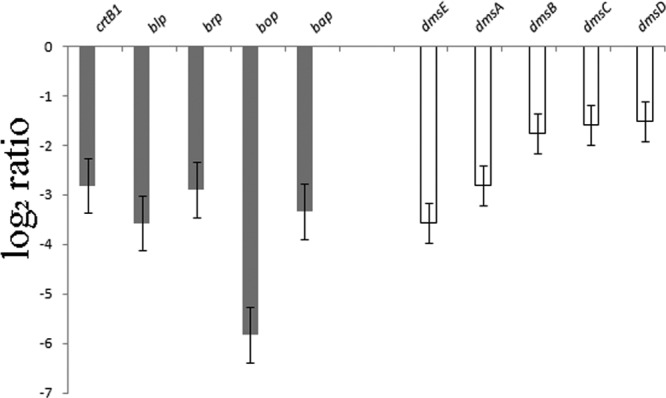
Gene expression in Halobacterium sp. NRC-1 Δbat and ΔdmsR regulatory mutants. Log2 ratios (y axis) between the Δbat mutant (gray bars) or ΔdmsR mutant (white bars) and NRC-1 are shown for genes of the bop gene cluster and the dms operon (genes are indicated above). Error bars indicate standard errors.